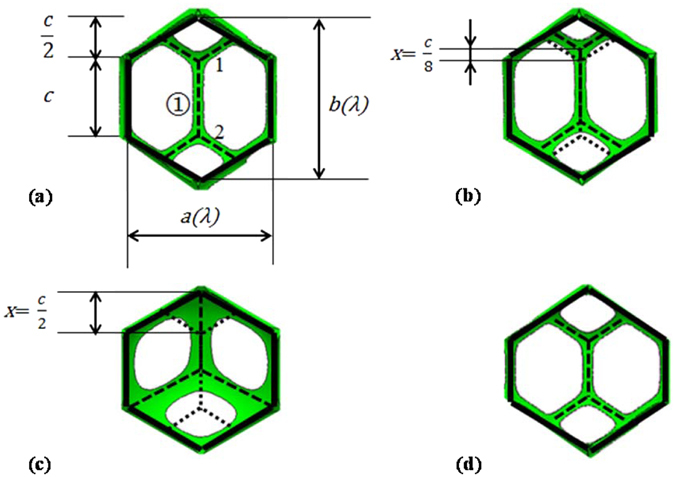
Figure 8.

Sketches of top views of local configurations of Tóth, Tóth-like and honeycomb-like structures cell in the Evolver model: (a) Perfect Tóth structure. Here, x = 0, α = 0, λ = 1, φ liq = 0.50%. (b) Tóth-like structure. Here, x = c/8, α = 0.25, λ = 1, φ liq = 0.50%. (c) Honeycomb-like structure. Here, x = c/2, α = 1, λ = 1.05, φ liq = 2.40%. (d) Tóth-like structure. Here, x = 0, α = 0, λ = 1.1, φ liq = 0.50%. In this figure, the foam cell/cell interface films are not shown, just the green Plateau border for clarity.
