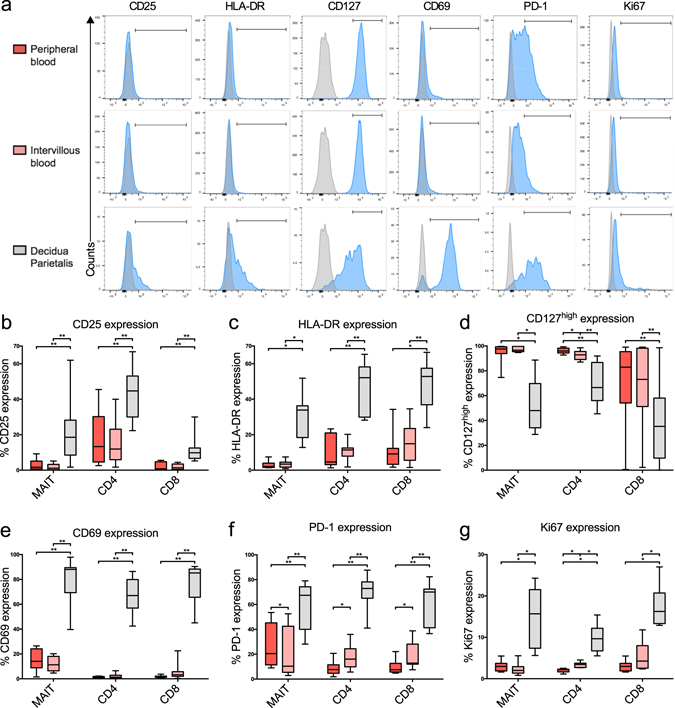
Figure 2.

Intervillous blood MAIT cells are not activated, but display a lower PD-1 expression compared to peripheral blood. (a) Representative flow cytometry histograms on MAIT cells showing the fluorescent minus one control (grey) and the sample (blue). Bars correspond to the gating strategy which was performed on dot plots. (b–g) Comparison between paired samples of peripheral blood (PB) (red), intervillous blood (IVB) (light red), and decidua parietalis (DP) (grey) cells. (b) CD25 and (c) HLA-DR expression on MAIT cells, CD4+ T cells, and CD8+ T cells (n = 11). (d) CD127high expression and (e) proportion of CD69 MAIT cells (n = 8), CD4+ T cells (n = 11) and CD8+ T cells (n = 11). (f) Expression of PD-1 in MAIT cells (n = 9), CD4+ T cells (n = 11) and CD8+ T cells (n = 11). (g) Intracellular Ki67 expression in MAIT cells, CD4+ T cells, and CD8+ T cells (n = 8). Box and whisker plots show median, interquartile range and range of paired samples. The Friedman test followed by the Wilcoxon signed rank test was used to detect statistically significant differences across multiple paired samples (b–g). A Bonferroni corrected p value was used. *P < 0.05, **P < 0.01.
