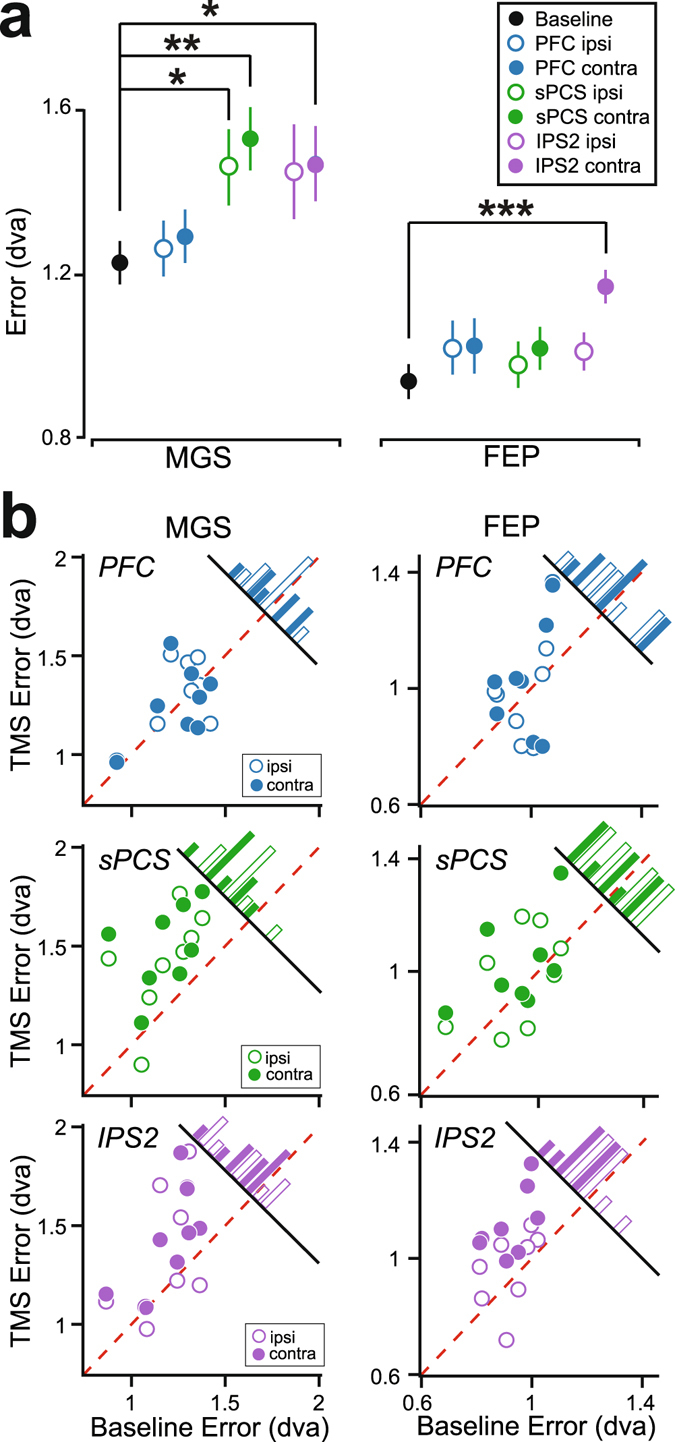
Figure 2.

Group average and individual working memory performance. (a) Compared to a baseline no TMS condition, sPCS TMS caused an increase in mean MGS errors especially in the visual field contralateral to the hemisphere of TMS, but not FEP errors. IPS2 TMS impaired mean FEP errors in the contralateral visual field. Dorsolateral PFC TMS caused no observable impairments. †p < = 0.08, *p < = 0.05, **p < = .005, ***p < = 0.0005. Error bars represent standard error of the mean. (b) Distribution of effects of TMS on working memory performance. TMS induced error (y-axis) is plotted against baseline error (x-axis) for both MGS and FEP, following PFC, sPCS, and IPS2 TMS. Histograms show the distributions of TMS induced error. Note that individual performance is remarkably consistent across subjects, and parallels the group-level results. For instance, sPCS TMS caused increased MGS error compared to baseline for every subject (all dots are to the left of the red dashed identity line). Additionally, IPS2 TMS caused increased FEP errors in every subject.
