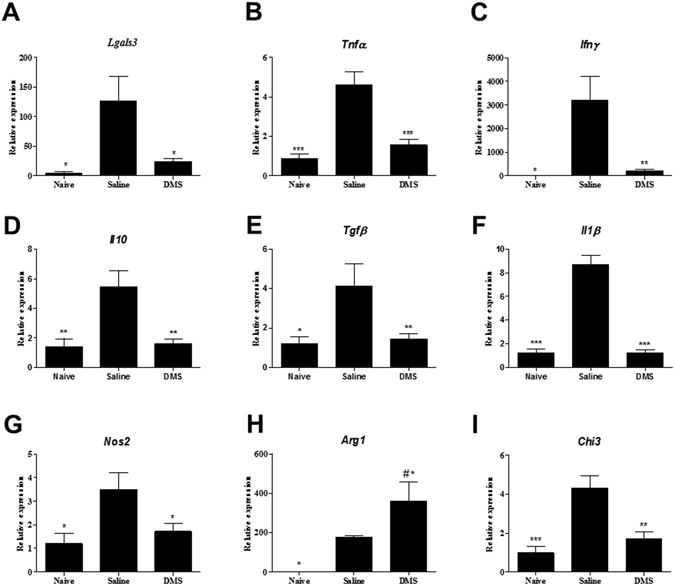
Figure 3.

Gene expression in the hearts of infected mice after DMS treatment. Analysis of gene expression was performed by real-time qRT-PCR using cDNA samples prepared from mRNA extracted from hearts of naive and chronic Chagasic mice treated with saline or DMS. (A) Gal-3, (B) TNFα, (C) IFNγ, (D) IL-10, (E) TGFβ, (F) IL-1β, (G) NOS2, (H) ARG1 and (I) CHI3 gene expression. Bars represent means ± SEM of 10 mice/group. ***P < 0.001; **P < 0.01; *P < 0.05 compared to saline group; # P < 0.05 compared to naive group.
