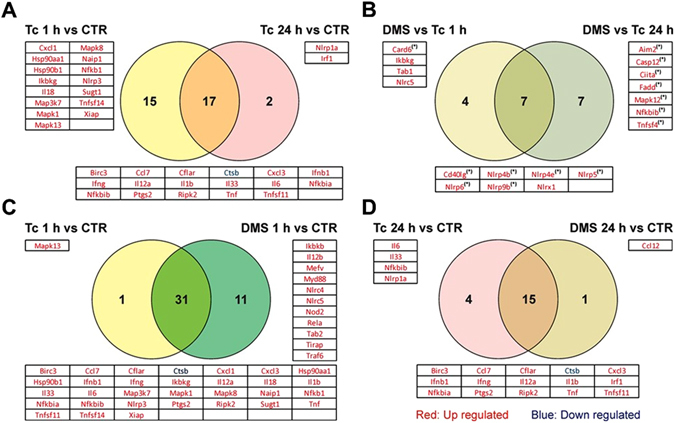
Figure 7.

Venn diagrams representing differentially expressed genes (DEG) through T. cruzi infection with or without DMS treatment. (A) Comparison between DEG after 25 h (Tc 1 h condition) or 48 h (Tc 24 h condition) after T. cruzi infection with respect to uninfected macrophages (CTR condition). (B) Analysis of common DEG by DMS treatment for 1 h (DMS 1 h) and 24 h (DMS 24 h) when compared to infected macrophages. (C) Comparison between DEG by T. cruzi infection with or without 1 h DMS treatment with respect to uninfected macrophages. (D) Comparison between DEG during 48 h infection with or without 24 h DMS treatment with respect to uninfected macrophages. (*) indicates genes with |FC| ≥ 2 but p-values > 0.05.
