
Fig. 2.
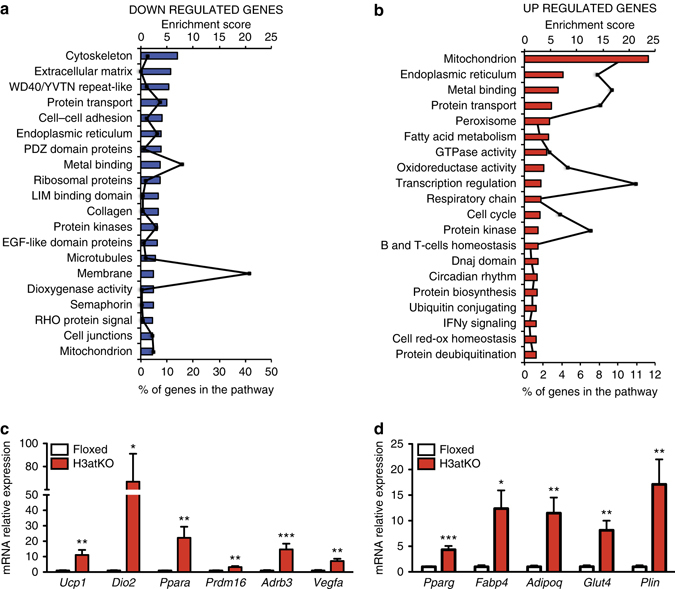
Differential transcriptome profile in IngWAT of floxed vs. H3atKO mice. a Down-regulated pathways in IngWAT of H3atKO mice; b Upregulated pathways in IngWAT of H3atKO mice (n = 3 per group, where each sample represents a pool from 2 individual mice); c, d qPCR gene expression analysis of browning genes and adipose markers in IngWAT of floxed and H3atKO mice (n = 9–11 per group). Data in c and d are presented as mean ± s.e.m. Statistical analysis: Student’s t-test, *p < 0.05, **p < 0.01, and ***p < 0.001