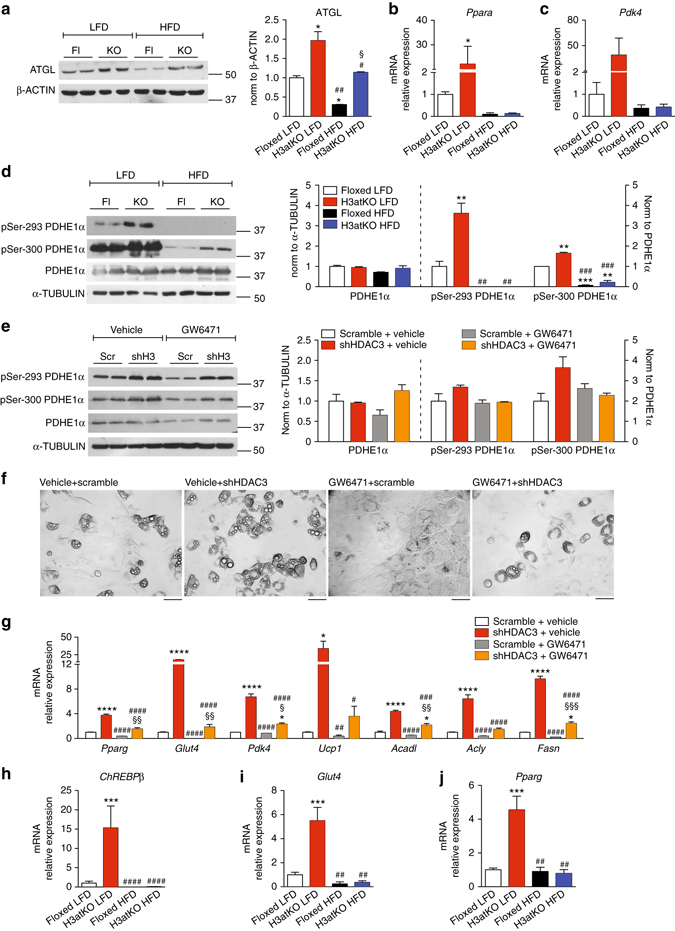
Fig. 8.

Role of PPARα and ChREBPβ in lipolysis and lipogenesis in WAT and in adipocytes. a Western blot analysis and quantification of ATGL in IngWAT from floxed and H3atKO mice fed LFD or HFD (n = 2, where each replicate represent a pool of samples from 3 mice); b, c mRNA expression of Ppara and Pdk4 in IngWAT from floxed and H3atKO mice fed LFD or HFD (n = 9–11 for LFD mice, n = 5 per group for HFD samples); d Western blot and quantification of pSer-293 PDHE1α, pSer-300 PDHE1α, PDHE1α in IngWAT of Hdac3 floxed and knock out mice fed LFD or HFD (n = 2, where each replicate represent a pool of samples from 3 mice); Data are presented as mean ± s.e.m. Statistical analysis: two way ANOVA, Tukey as post hoc test, *p < 0.05, **p < 0.01, ***p < 0.001 vs. Floxed LFD, # p < 0.05, ## p < 0.01, ### p < 0.001 vs. H3atKO LFD, § p < 0.05, §§ p < 0.01, §§§ p < 0.001 vs. Floxed HFD. e Western blot and quantification of pSer-293 PDHE1α, pSer-300 PDHE1α, PDHE1α in cells infected with adenovirus expressing shRNA targeted to Hdac3 or to a scrambled control shRNA (scramble) and differentiated in presence of vehicle or 10 μM GW6471 (n = 2, where each replicate represent a pool of 3 samples); f Morphology of cells infected with adenovirus expressing shRNA targeted to Hdac3 or to a scrambled control shRNA (scramble) and differentiated in presence of vehicle or 10 μM GW6471, scale bar is 50 μm; g Gene expression analysis on mRNA from cells infected with adenovirus expressing shRNA targeted to Hdac3 or to a scrambled control shRNA (scramble) and differentiated in presence of vehicle or 10 μM GW6471 (n = 3 per group). Data are presented as mean ± s.e.m. Statistical analysis: two-way ANOVA, Tukey as post hoc test, *p < 0.05, **p < 0.01, and ***p < 0.001 vs. Scramble + Vehicle, # p < 0.05, ## p < 0.01, and ### p < 0.001 vs. shHDAC3 + Vehicle, § p < 0.05, §§ p < 0.01, and §§§ p < 0.001 vs. Scramble + GW6471. h–j mRNA expression of ChREBPβ, Glut4, Pparg in IngWAT of Hdac3 floxed and knock out mice fed LFD or HFD (n = 9–11 for LFD mice, n = 5 per group for HFD samples); Two-way ANOVA, Tukey as post hoc test, *p < 0.05, **p < 0.01, and ***p < 0.001 vs. Floxed LFD, # p < 0.05, ## p < 0.01, and ### p < 0.001 vs. H3atKO LFD
