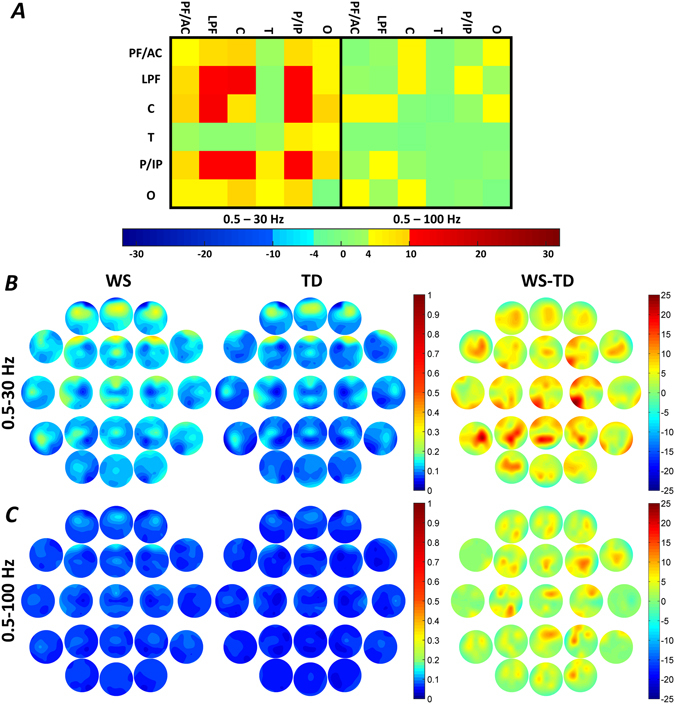
Figure 2.

Region-specific NREM sleep EEG broadband-1 (0.5–30 Hz) and broadband-2 (0.5–100 Hz) WPLI differences. (A) Broadband-1 WPLIs are significantly higher in Williams syndrome as compared to the typically developing group in several intra- and inter-regional pairings. Color codes: Red = Williams syndrome > typically developing (B-H corrected), Yellow-orange = Williams syndrome > typically developing (uncorrected), Green = Williams syndrome ≈ typically developing, Light blue = Williams syndrome < typically developing (uncorrected), Blue = Williams syndrome < typically developing (B-H corrected). (B,C) Broadband-1 and broadband-2 WPLI maps highlighting the patterns of absolute group means (left: Williams syndrome; middle: typically developing) and Williams syndrome-typically developing differences (right). Positions of the maps represent the seed derivation of the synchronization analyses (according to the 10–20 system), while the color patterns are the representations of the variable strengths in the synchronization (WPLI) between the respective region and the seed derivation.
