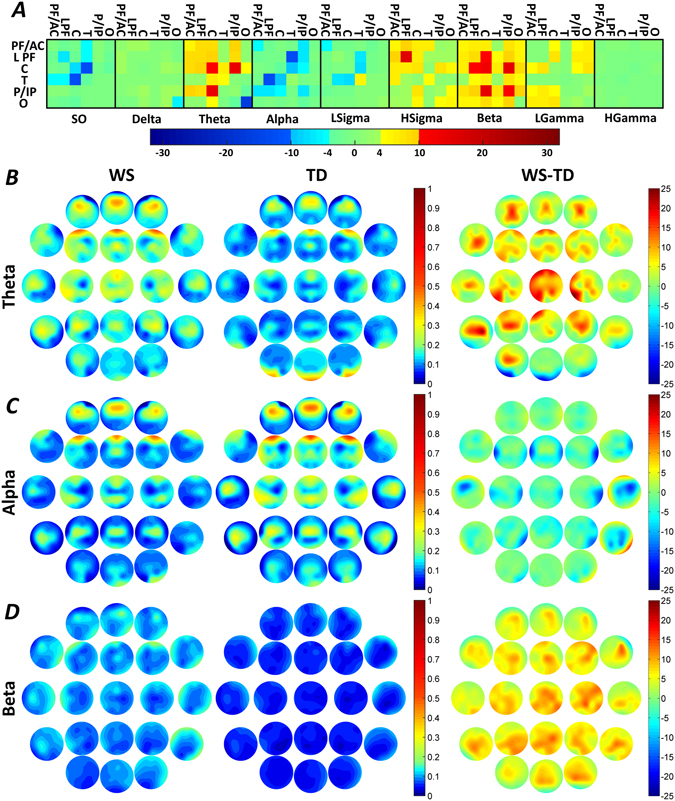
Figure 3.

Region-specific and band-limited NREM sleep EEG connectivity differences. Decreased WPLI was evidenced in the slow oscillation range for the C-T inter-regional pairing, as well as in the intra-regional O theta and LPF-T alpha synchronizations. Several Williams syndrome-specific increases in WPLIs were found in the theta, high sigma and beta ranges. Frequency range codes: SO = Slow oscillation, LSigma = Low sigma, HSigma = High sigma, LGamma = Low gamma, HGamma = High gamma. Color codes: Red = Williams syndrome > typically developing (B-H corrected), Yellow-orange = Williams syndrome > typically developing (uncorrected), Green = Williams syndrome ≈ typically developing, Light blue = Williams syndrome < typically developing (uncorrected), Blue = Williams syndrome < typically developing (B-H corrected). B-D. Theta, alpha and beta WPLI maps highlighting the patterns of absolute group means (left: Williams syndrome; middle: typically developing) and Williams syndrome-typically developing differences (right). Positions of the maps represent the seed derivation of the synchronization analyses (according to the 10–20 system), while the color patterns are the representations of the variable strengths in the synchronization (WPLI) between the respective region and the seed derivation.
