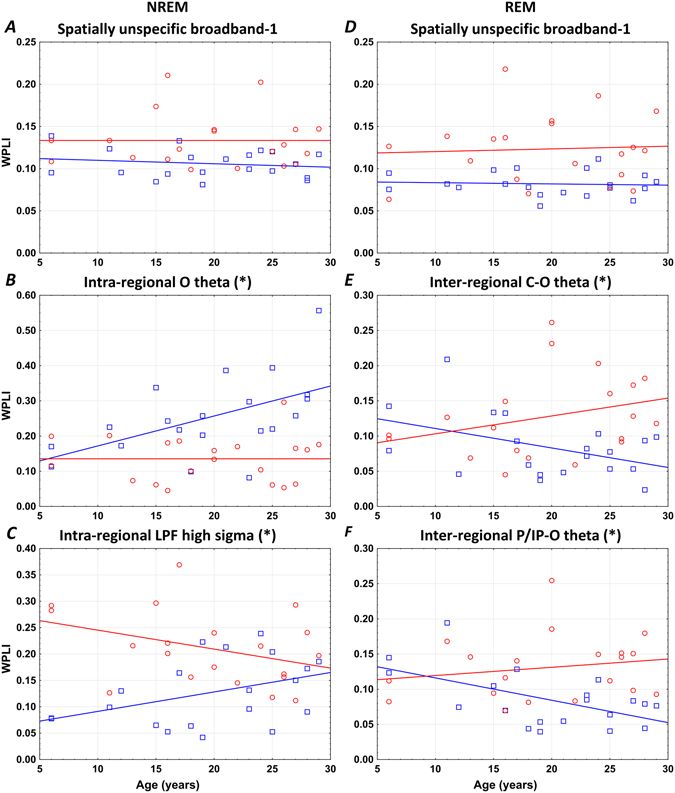
Figure 7.

Developmental trajectories of neural connectivity. (*) Denotes significant age × group effects based on homogeneity of slopes analysis indicating altered developmental patterns of sleep-related neural connectivity in Williams syndrome. Left column: NREM sleep, right column: REM sleep. Color codes: Red = Williams syndrome, blue = typically developing. (A and D) are examples of the 131 age-independent Williams syndrome vs. typically developing group differences in sleep EEG WPLI values. (B and C) Show the lack of an age-dependent increase in NREM sleep EEG connectivity (intra-area O theta and intra-area LPF high sigma), while (E and F) reflect the lack of any age-related decrease in REM sleep neural connectivity (inter-area C-O and P/IP-O theta) in Williams syndrome subjects.
