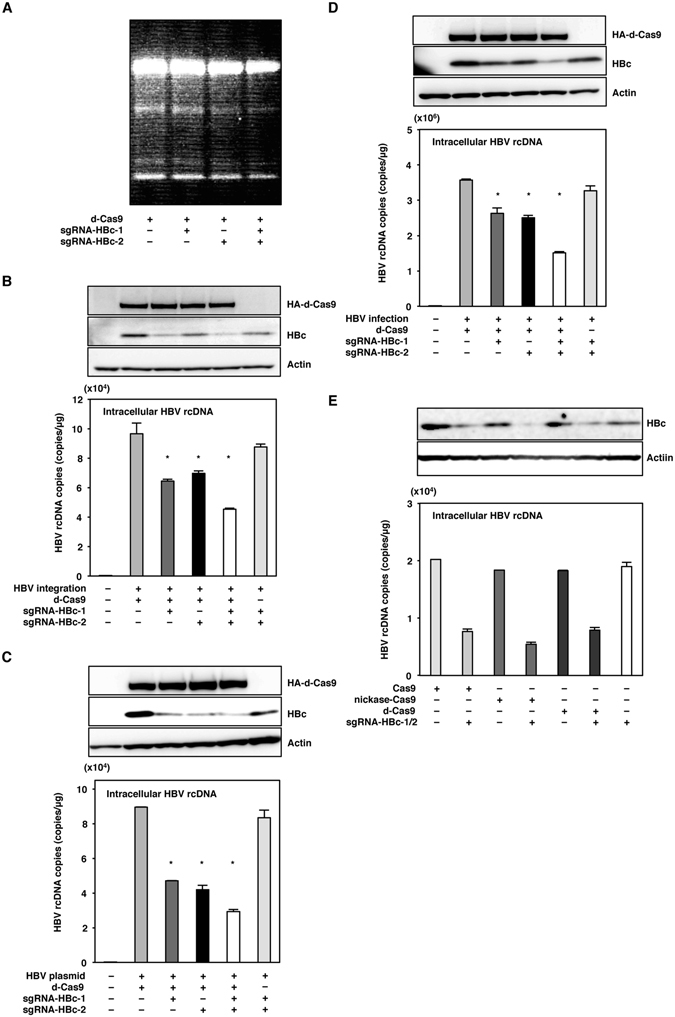
Figure 4.

The binding of the Cas9 complex to the HBV genome suppressed HBV infection. (A) d-Cas9 with sgRNA-HBc-1 and/or sgRNA-HBc2 were lentivirally transduced in HepG2.2.15.7 cells. Total DNA was collected at 5 days post-transduction, and mutations of the HBV genome in HepG2.2.15.7 cells were detected by surveyor assay. (B) HepG2.2.15.7 cells transduced with d-Cas9 and the sgRNAs were collected at 5 days post-transduction, and the expression of HBc was determined by immunoblotting. Intracellular HBV rcDNAs were extracted at 5 days post-transduction and quantified by qPCR. (C) Huh7 cells transduced with d-Cas9 and the sgRNAs were transfected with a plasmid containing 1.3-fold-overlength genome of HBV at 3 days post-transduction. Cell lysates were collected at 3 days post-transfection, and the expression of HBc was determined by immunoblotting. Intracellular HBV rcDNAs were extracted at 3 days post-transfection and quantified by qPCR. (D) Nuclease dead Cas9 with the sgRNAs was lentivirally expressed in Huh7 cells. The plasmid containing 1.3-fold-overlength genome of HBV was transfected at 3 days post-transfection. Cell lysates were collected at 3 days post-transfection, and the intracellular HBc protein levels were determined by an immunoblotting analysis. Intracellular HBV rcDNAs were extracted at 3 days post-transfection and quantified by qPCR. (D) HepG2-hNTCP-C4 cells expressing d-Cas9 and the sgRNAs by lentivirus vector were infected with HBV derived from the supernatants of HepAD38.7 cells at 3 days post-transduction. Cell lysates were collected at 10 days post-infection, and the expression of HBc protein was determined by immunoblotting. Intracellular HBV rcDNAs were extracted at 10 days post-infection and quantified by qPCR. (E) Cas9, nickase-Cas9 and d-Cas9 with a pair of the sgRNAs were lentivirally expressed in HepG2.2.15.7 cells. The expression of HBc and the production of HBV rcDNAs were determined at 5 days post-transduction by immunoblotting and qPCR, respectively. *p < 0.01 vs. the results for control cells. (full-length gels are presented in Supplementary Figure).
