Figure 3.

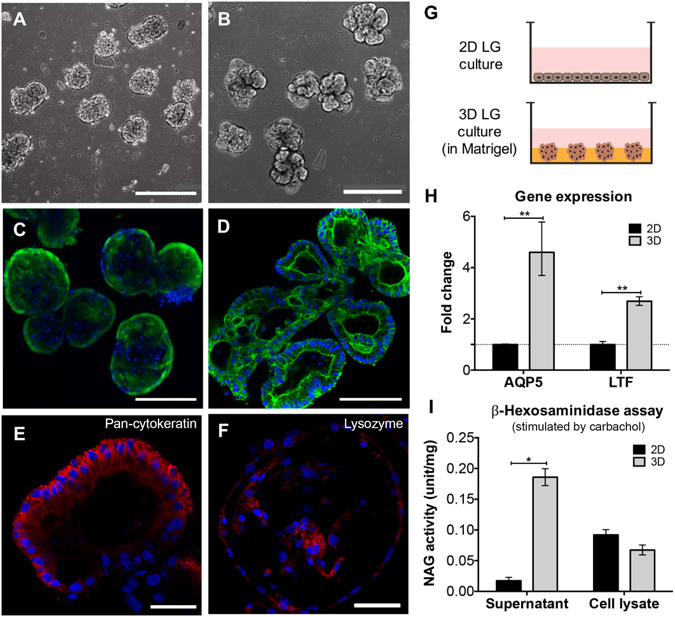
3D lacrimal gland (LG) cell spheroids formation and culture. (A–D) Phase contrast and F-actin staining (Phalloidin) images of LG cell spheroids in Matrigel at different stages. (A,C) day 2; (B,D) day 5. (E,F) IHC showing the expression of LG specific markers (red; counterstained by DAPI). (E) Pan-cytokeratin; (F) lysozyme. Scale bar: 400 μm (A,B); 200 μm (C); 100 μm (D); 50 μm (E,F). (G) Schematics of LG cultured as either 2D monolayer or 3D spheroids embedded in Matrigel. (H) Gene expression (RT-qPCR; fold change is expressed as 2−ΔΔCT) and (I) β-hexosaminidase assay comparing LG cells culture under 2D and 3D conditions. Both supernatant and cell lysate were collected for hexosaminidase assay and the value (units) was normalized to total protein content (mg). *p < 0.05; **p < 0.001.
