
Figure 5.
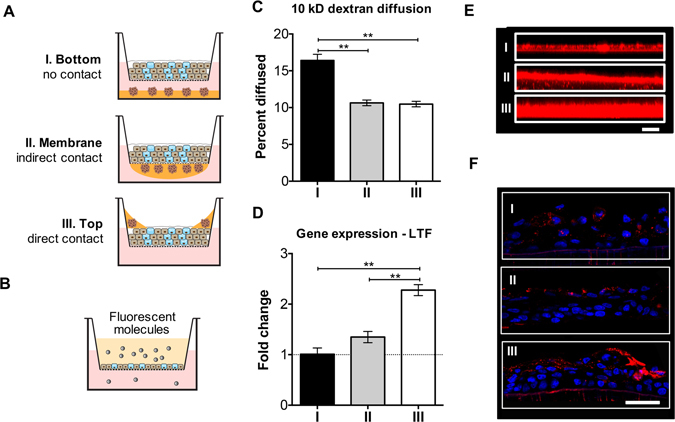
Comparison of different coculture model systems. (A) The three different designs of coculture system, which were named after the relative interactions between CECs and LG cell spheroids. (B,C) Diffusion study (with fluorescent 10 kD dextran). Data in (C) was presented as percent of dextran diffused through. (D) LTF gene expression across the three coculture designs. (E) Secreted mucin layer from airlifted CECs in coculture, visualized by confocal microscopes (z scan). Scale bar 100 μm. (F) MUC5AC IHC staining (red fluorescence; nuclei were counterstained with DAPI) of the airlifted CECs. Scale bar 50 μm. *p < 0.05; **p < 0.001.