
Figure 2.
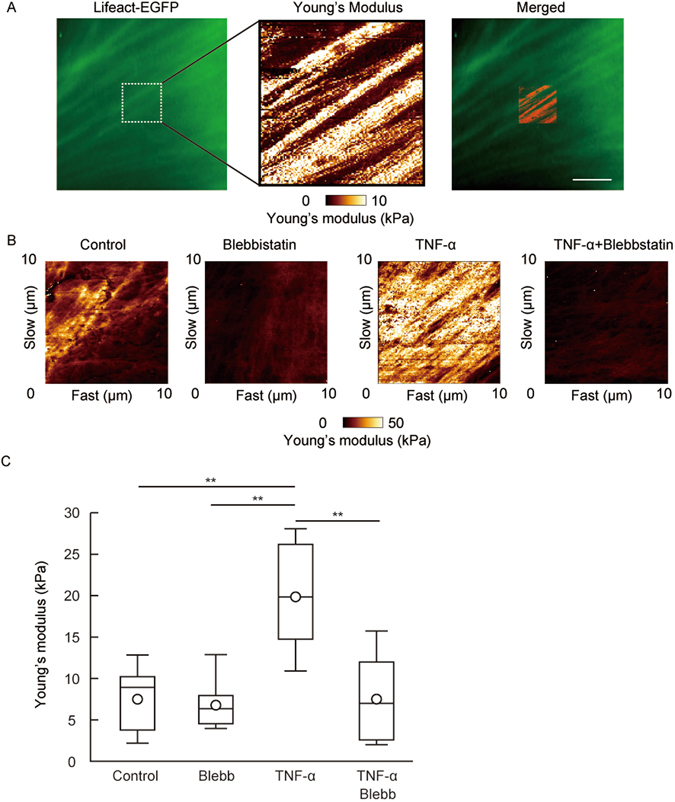
Actin localization at the area of stiffness in the cell. (A) Actin localization in living HUVECs was visualized by Lifeact-EGFP and the cellular stiffness of the actin-localized part of HUVECs was measured (n = 3). Actin localization (left panel) and Young’s modulus image (center panel) are shown. Both images of actin localization and the Young’s modulus were merged (right panel). Scale bar showing 10 μm. (B) Young’s modulus images of HUVECs treated with 10 μM blebbistatin and/or TNF-α for 4 hours are shown. (C) The Young’s modulus of control group (n = 5), blebbistatin group (n = 5), TNF-α group (n = 5), and TNF-α and blebbistatin group (n = 6). Representative data from two experiments are shown. *P < 0.05, **P < 0.01; measured using a Tukey’s test followed by two-way ANOVA.