
Fig. 3.
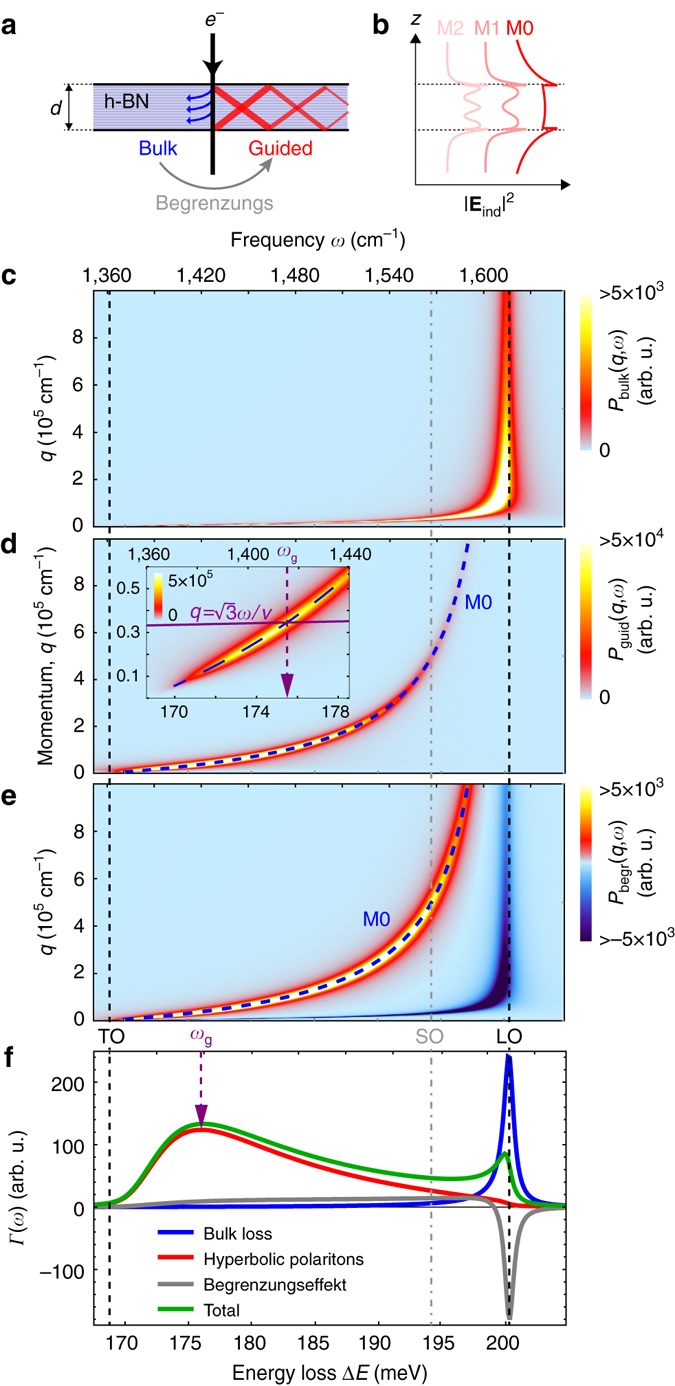
Theoretical EEL probability spectrum of a homogeneous h-BN slab. a Schematic representation of the electron energy loss due to the excitation of the bulk phonon (left) and guided modes (right) in a dielectric slab. b Intensity profiles of three guided HPhP modes (M0, M1, and M2). c Energy-momentum map P bulk(q,ω) calculated for a 30-nm-thick h-BN slab. d Same as in c, but showing P guid(q,ω). e Same as in c, but showing P begr(q,ω). The dashed curves in d and e depict the dispersion of M0 mode of the hyperbolic phonon polariton (calculated according to the Supplementary Eq. (27))29. Inset in d is a close up on P guid(q,ω) at low momenta; dashed purple arrow shows the energy ω g at which the line (solid purple line, corresponding to the maximum of momentum transfer from electron to the guided mode) intersects with the M0-HPhP mode dispersion. f EEL probabilities, Γ(ω), corresponding to bulk (blue), guided-mode (red), Begrenzungseffekt (gray) losses and their sum (green). The vertical purple arrow marks the same energy as in the inset of d. In all plots, the vertical dashed lines mark the TO and LO phonon frequencies; vertical dot-dashed line marks the location of the SO energy (corresponds to ϵ ⊥ = −1)