Figure 2.

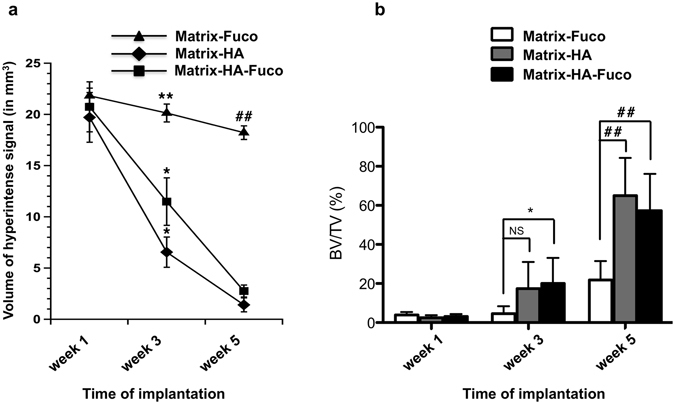
(a) Volume of the hyper-intense signal measured on the in vivo 3D WS-bSSFP images within the bone defects filled with the 3 biomaterials over weeks 1, 3 and 5. (b) BV/TV measurements from the ex vivo Micro-CT scans analysis. NS: Non Significant differences. Significant differences between biomaterials at each week are indicated with *p < 0.05 and **p ≤ 0.01 for week 3 and ##p ≤ 0.01 for week 5. Of note, the MRI volumes measured in Matrix-HA-Fuco filled defects were significantly different to each other at every time point. The MRI volumes measured in Matrix-HA filled defects at week 1 was significantly different to the ones obtained at week 3 and week 5. Similarly, the MRI volumes measured in Matrix-Fuco filled defects at week 5 was significantly different to the one obtained at week 1.
