
Figure 6.
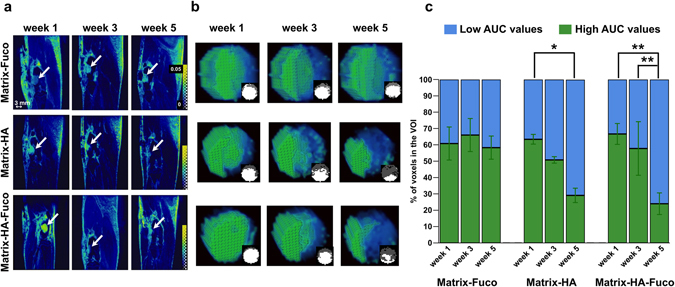
(a) 3D parametric AUC maps of the bone defects that received the biomaterials. A slice showing each defect at each time point was extracted from the 3D maps. For each biomaterial group, the same rat is displayed over weeks 1, 3 and 5. The white arrows show the defect. The color scale represents the AUC values between 0 and 0.05. (b) 3D rendering of each biomaterial defect extracted and magnified at weeks 1, 3 and 5 post-implantation. Voxels with high AUC values are colored in green and voxels with low AUC values are colored in blue. The small inserts are 2D slices extracted from the 3D AUC maps, located at the center of the defect. The amount of fast-perfused voxels (with low AUC) increased over time in the Matrix-HA and Matrix-HA-Fuco filled defects. In contrast, no change with time was measured in the defects filled with Matrix-Fuco biomaterial. (c) Quantitative analysis of the percentage of pixels with high (green) and low (blue) AUC from the extracted Volume-of-Interest (VOI) for the 3 different biomaterials at weeks 1, 3 and 5. Values are means ± Standard Deviations. Significant differences between each week are indicated with *p < 0.05 and **p ≤ 0.01. Of note, the percentage obtained on the Matrix-HA-Fuco filled defects at week 5 was significantly different to the ones obtained at week 1 and week 3. Similarly, the percentage obtained on the Matrix-HA filled defects at week 1 was significantly different to the ones obtained at week 5. On the contrary, the percentages obtained on the Matrix-Fuco filled were not significantly different at any time point.