
Figure 2.
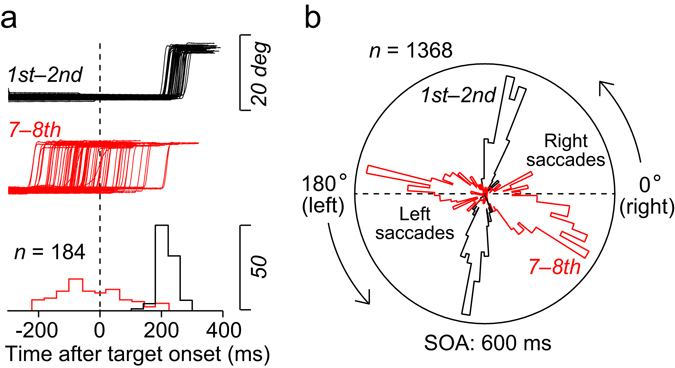
Reactive and predictive saccades in representative experiments. (a) Eye position traces of the 1st–2nd (black) and 7–8th (red) rightward saccades for trials with a 600-ms SOA in a single experimental session. Data are aligned with the target onset (vertical dashed line), and lower histograms summarize saccade latencies. Note that while the initial two saccades in the sequence were reactive, the later saccades were often synchronized with (or even preceded) target appearance. (b) Circular histogram of saccade timing for 5 experimental sessions in monkey K. 0° and 180° indicate the timing of right and left target onset, respectively. Each cluster of the histogram is normalized for the peak value.