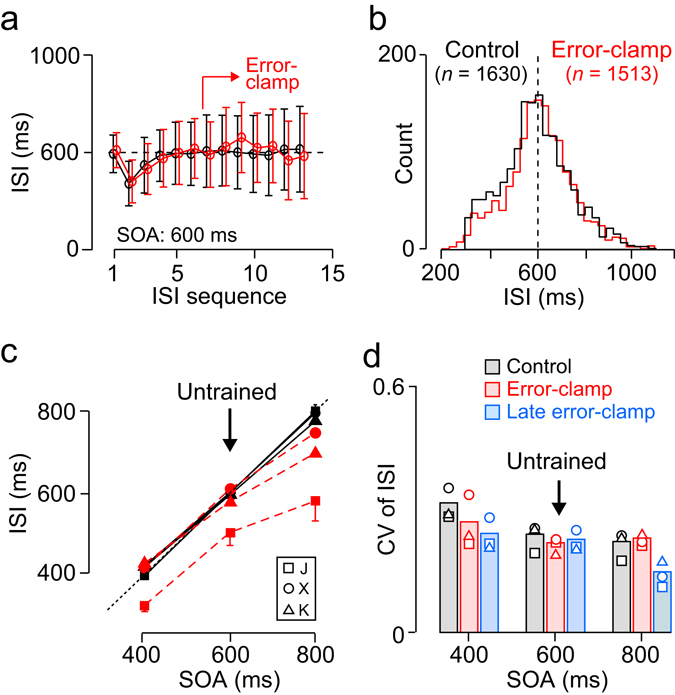
Figure 4.

Entrainment to periodic stimuli. (a) Inter-saccadic intervals (ISIs) are plotted as a function of saccade sequence for 5 experimental sessions in monkey X. In the error-clamp trials (red), the target appeared when the monkey looked at the target location (≥7th saccade in the sequence). Error bars indicate ± SD (inter-trial variation). (b) Distributions of ISIs for the 7–12th saccades (clamp period) in trials with (red) and without (black) error-clamp. (c) The ISIs as a function of SOA in the error-clamp (red dashed lines) and non-clamp (control) conditions (black solid lines) for different animals. Error bars indicate SDs of 5 experimental sessions and are shown only for some data points. (d) Coefficient of variation (CV) of ISI for different SOAs. Each data point shows the mean of 5 sessions for each monkey. Blue bars indicate the data during the late part (>2000 ms) of error-clamp condition.
