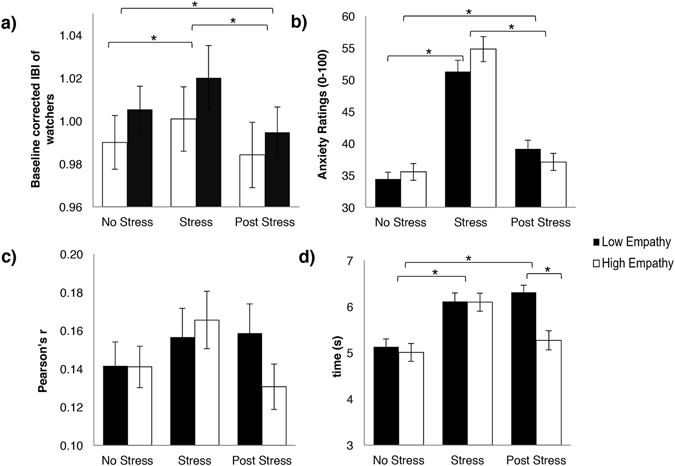
Figure 1.

Overview of observers’ responses to viewing videos (a) Baseline corrected mean IBI of low and high empathy observers while viewing videos. (b) Mean anxiety ratings made by low and high empathy observers while viewing videos. (c) Mean maximum time-lagged correlation between IBI of speakers and observers. (d) Mean lag (in seconds) to reach maximum correlation between speaker and observer IBI. All error bars represent standard error. *=Statistically significant after Bonferroni correction (p < 0.05).
