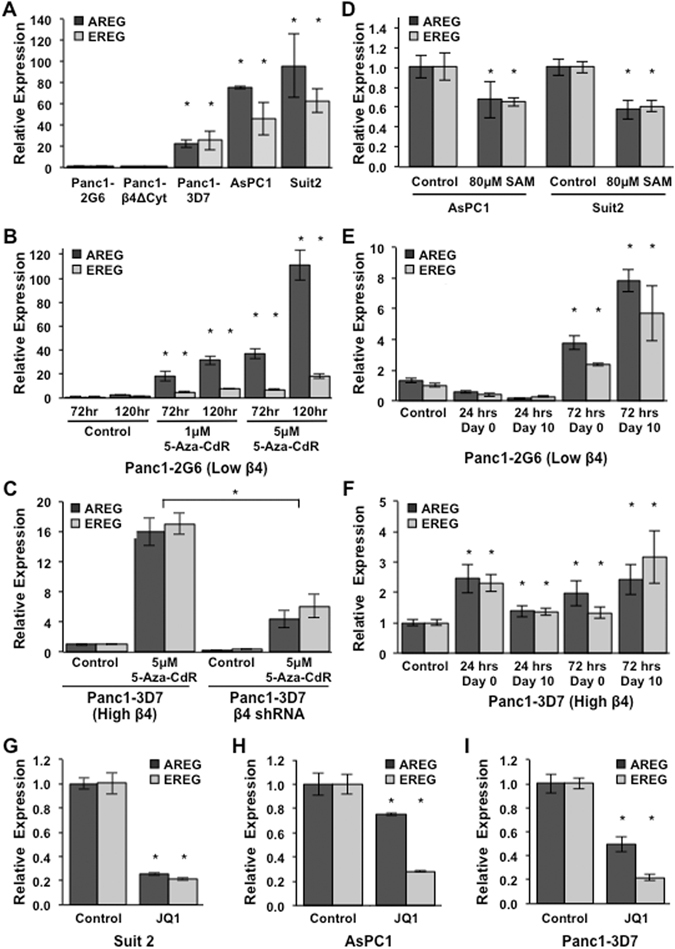
Figure 2.

AREG and EREG expression is mediated by DNA demethylation in response to signaling from the integrin α6β4. (A) Expression of AREG and EREG was compared in Panc1-2G6 (low α6β4) and cells expressing a dominant negative α6β4 (Panc1-β4ΔCyt), Panc1-3D7, Suit2, and AsPC1 (high α6β4; in order of increasing expression) cell lines. (B) Panc1-2G6 cells (low α6β4) were treated with vehicle only (control) or with 1 μM or 5 μM 5-aza-2′-deoxycitine (5-aza-CdR) in fresh medium daily for 3 or 5 days. (C) Panc1-3D7 stably expressing an shRNA targeting the β4 subunit or a non-targeting (NT) shRNA control vector were treated with 2 μM 5-aza-CdR for 3 days and then assessed for AREG and EREG expression. (D) AsPC1 and Suit2 (high α6β4) were treated with vehicle only (control) or 80 μM S-adenosylmethione (SAM) in fresh medium daily for 5 days (E,F). Panc1-2G6 (E) and Panc1-3D7 (F) cells were treated with 2 μM 5-aza-CdR for 24 or 72 hours, 5-aza-CdR was removed and cells were either collected immediately or maintained in culture for 10 days. (G–I) Cells with high integrin α6β4 were treated with vehicle only (control) or 0.5 μM JQ1 overnight and harvested for analysis by QPCR. For all experiments RT-PCR was used to convert RNA to cDNA and QPCR was used to assess AREG and EREG expression. Data depicted here are representative of at least three different experiments and represent the mean +/− standard deviation. Statistical significance was calculated using a one-tailed t-test in which * denotes P < 0.05 as compared to controls, unless otherwise indicated.
