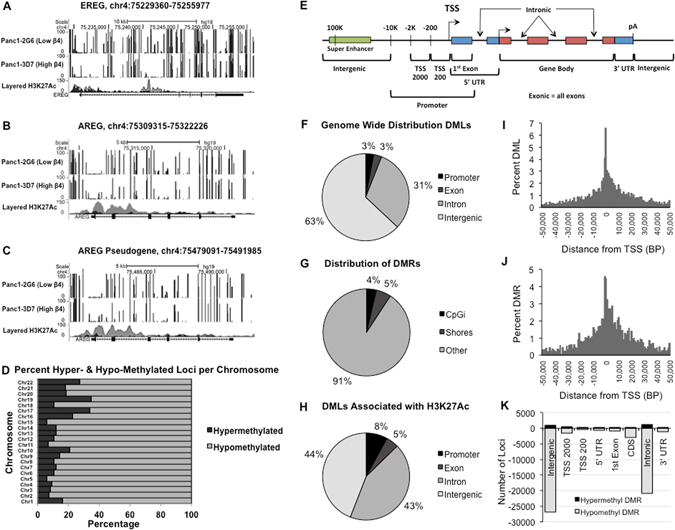
Figure 3.

The integrin α6β4 drives both gene specific and global DNA hypomethylation. (A–C) Genomic DNA from Panc1-2G6 (β4 low; upper panels) and Panc1-3D7 (high β4; lower panels) was processed for high-resolution methyl-seq by the NextGen Sequencing Core at the Norris Comprehensive Cancer Center. Samples were analyzed bioinformatically and percent methylation shown for EREG (A), AREG (B), and AREG pseudogene (C). (D) Percent hypomethylation and hypermethylation per chromosome when comparing Panc1-3D7 vs. Panc1-2G6. (E) Defined regions of interest assessed for changes in DNA methylation (F) Location of DMLs across the genome. (G) Percent of methylation changes located in CpG islands and shores. (H) Location of DMLs associated with H3K27Ac. (H) Distance from TSSs for DMLs (I) Distances from TSSs for DMRs (J) Number of both hypomethylated and hypermethylated regions corresponding to genomic features.
