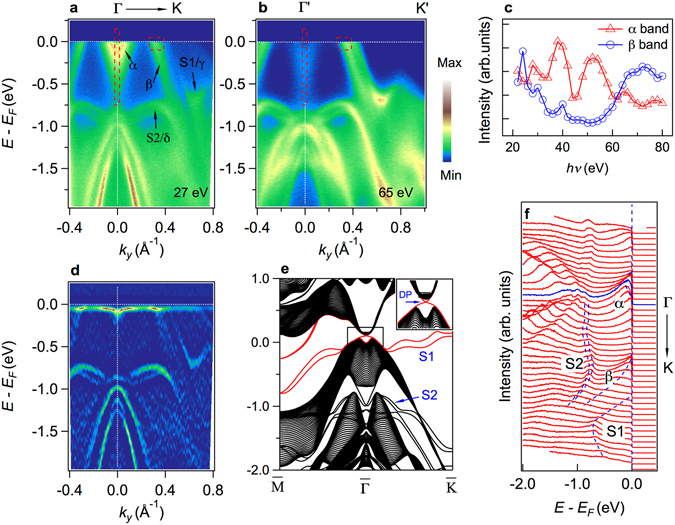
Figure 3.

Texture of band inversion and surface states compared with calculations. (a) ARPES intensity plot of band structure along Γ-K recorded with hv = 27 eV. (b) Same as (a) but hv = 65 eV. (c) The integrated intensity of α band and β band versus photon energy. (d) Curvature intensity plot of (a). (e) The calculated surface states of SrSn2As2 (001) surface. The inset shows the Dirac Point (DP). (f) Energy distribution curves (EDCs) of (a).
