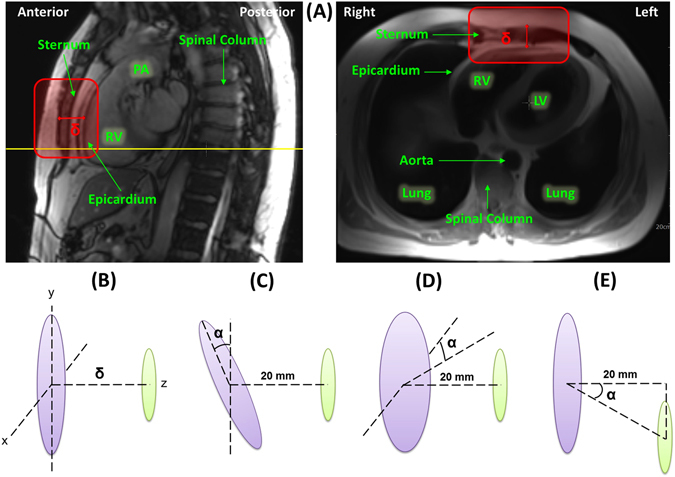
Figure 3.

Determining Range of Function. (A) Thoracic MR images in which the left image shows the sagittal view with the yellow line representing the cross-reference line for the axial black blood image in right image. The red box represents the region in which measurements were made in both views. The distance, δ, represents the displacement measured along the region of the red box in which the receiver will be located in the anterior cardiac vein and the transmitter will be located in the anterior chest wall below the adipose tissue along the sternal border. PA: pulmonary artery, RV: right ventricle, LA: left ventricle. (B) Antenna assessment at distance, δ, (C) Antenna assessment with x-axis angular misalignment at angle, α, (D) Antenna assessment with y-axis angular misalignment at angle, α, and (E) Antenna assessment with displacement misalignment at angle, α.
