Figure 1.

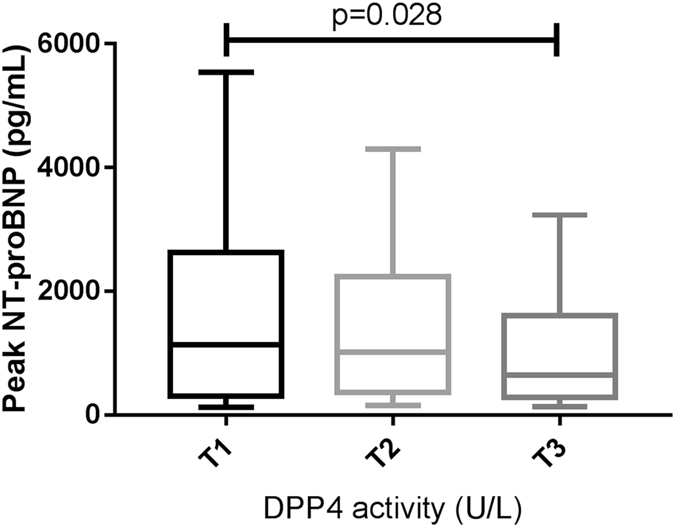
Peak NT-proBNP according to plasma DPP4 activity tertiles in STEMI patients. Values represent as median with interquartile range. Box plots show the 10th and 90th (vertical lines), 25th and 75th (boxes) and 50th (horizontal line).

Peak NT-proBNP according to plasma DPP4 activity tertiles in STEMI patients. Values represent as median with interquartile range. Box plots show the 10th and 90th (vertical lines), 25th and 75th (boxes) and 50th (horizontal line).