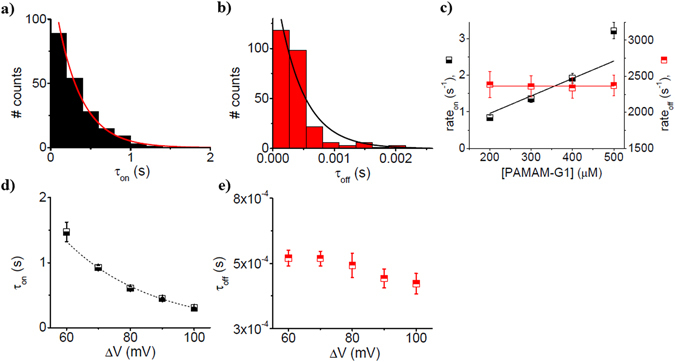
Figure 6.

The kinetics description of PAMAM-G1 – α-HL interactions in 0.5 M KCl, at pH = 7. Representative histograms of the inter-event (τon) (panel a) and blockade duration intervals (τoff) (panel b) characterizing the PAMAM-G1 – α-HL interactions recorded at ΔV = +100 mV, in 0.5 M KCl, at pH 7, with the trans-side added dendrimer (500 μM). The histograms were fitted with mono-exponential functions, and corresponding reaction rates describing the PAMAM-G1 – α-HL interactions were derived. The dendrimer capture rate by the nanopore (rateon, ‘ ’ – ‘down-filled squares’), and the dissociation rate (rateoff, ‘
 ’ – ‘up-filled squares’) are shown in panel c. The voltage-dependence of inter-event times (τon) and blockade durations (τoff) are shown in panels d (‘
 ’ – ‘down-filled squares’) and e (‘
 ’ – ‘up-filled squares’).
