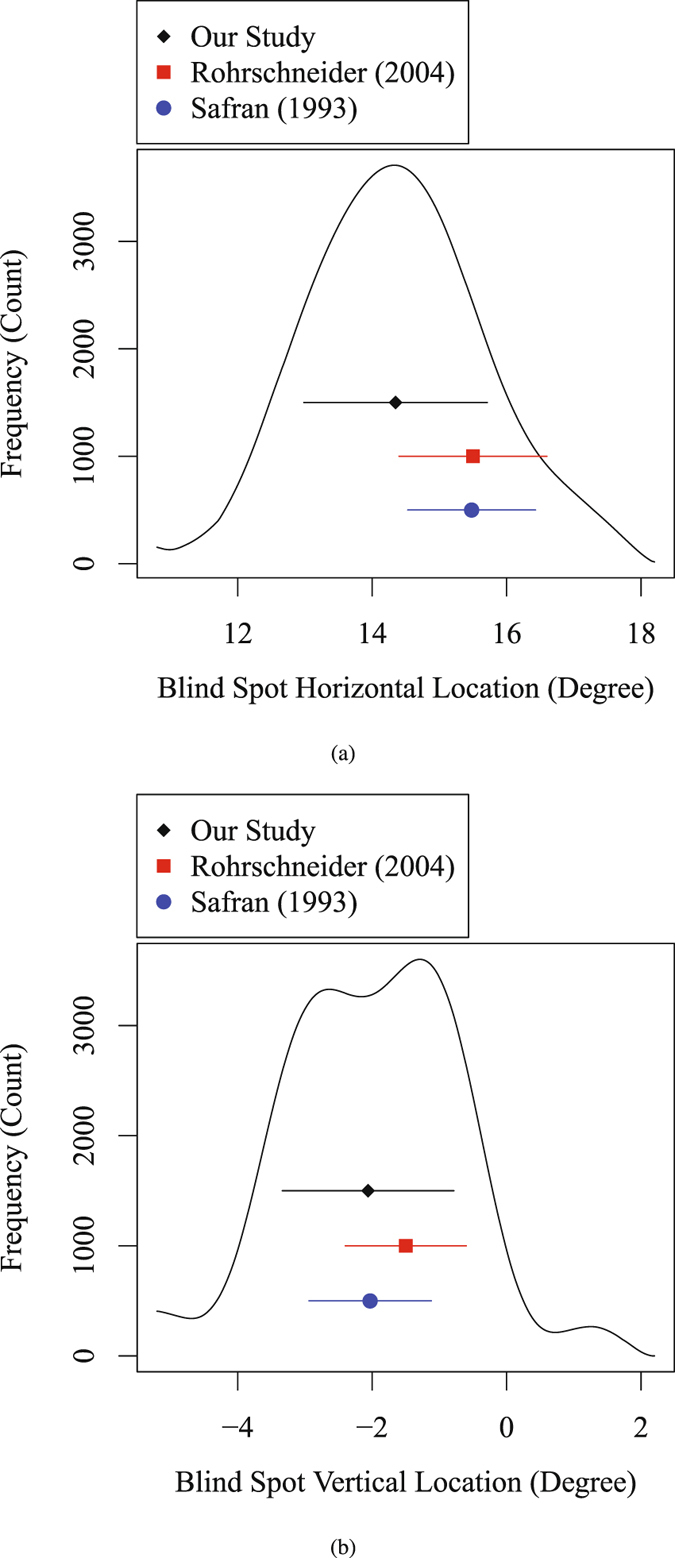
Figure 2.

Blind spot marginal distribution in (a) horizontal direction and (b) vertical direction from the current study and previous studies in literature. Black diamond and line denote the mean and standard deviation of NBSL calculated in our work, blue dot and line denote the mean and standard deviation of NBSL in the work by Safran et al.20, and red square and line denote the mean and standard deviation of the optic disc location relative to fovea in the work by Rohrschneider21.
