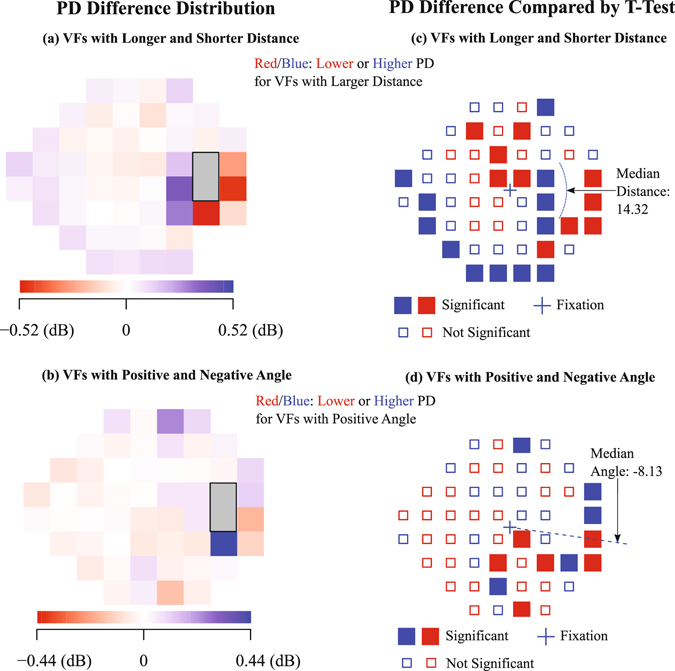
Figure 4.

PD value difference effects with respect to NBSL relative to fixation. PD difference compared by t-test (a) and spatial distribution (b) between the group with NBSL distances longer or equal than the median of all NBSL distances and the group with NBSL distances shorter than the median of all NBSL distances. PD difference compared by t-test (c) and spatial distribution (d) between the group with NBSL angles larger or equal than the median of all NBSL angles and the group with NBSL angles smaller than the median of all NBSL angles. P-values less than 0.05 after multiple comparison correction with false discovery rate were considered as significant.
