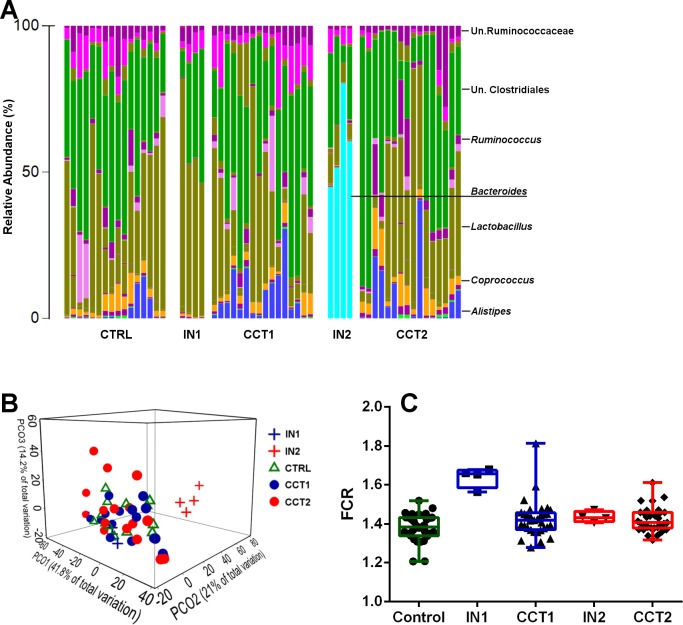
Figure 1. Barchart showing cecal microbiota at the genus level of all 3 treatment groups and their corresponding inoculums (A).
Bray–Curtis genus level PCoA plot (B) and FCR differences between the groups and inoculums used for cecal content swabbing (C). CTRL = Control, IN1 = Donors for the inoculum used for Cecal Content Treatment 1 (CCT1); IN2 = Donors for the inoculum used for Cecal Content Treatment 2 (CCT2).

