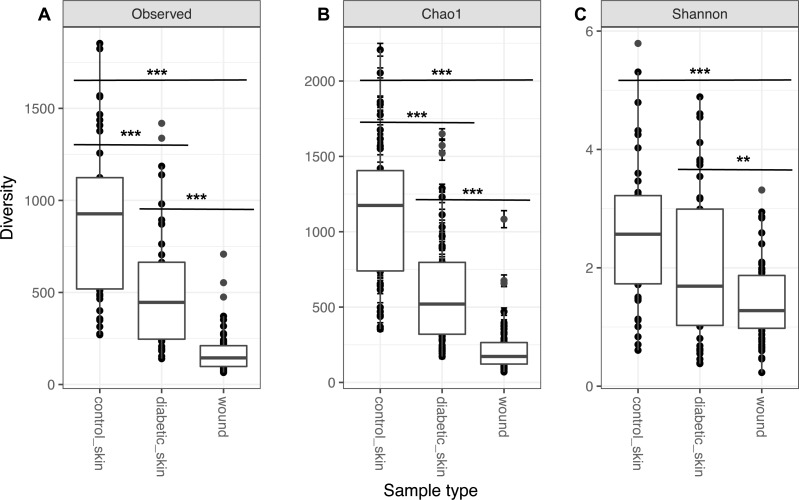
Figure 1. Alpha diversity of skin and wounds.
Box plots of 3 different alpha diversity measures, (A) observed number of OTUs or richness, (B) the Chao I estimator, and (C) the Shannon index, based on OTUs clustered at 97% similarity for control skin, diabetic skin and diabetic wounds. Significant differences are indicated by asterix ∗ = p < 0.05, ∗∗ = p < 0.01 ∗∗∗ = p < 0.001.

