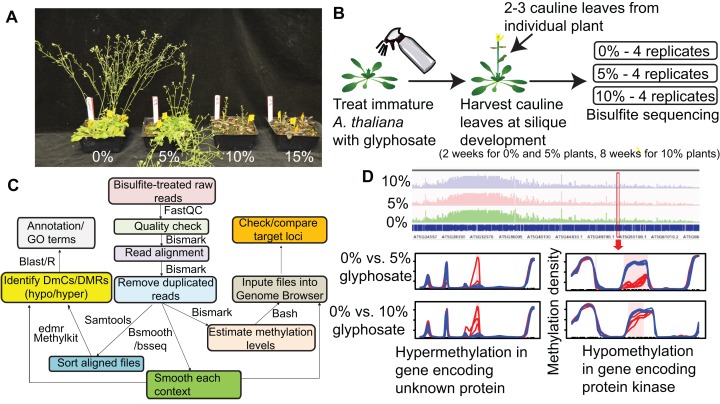
Figure 1. Overview of experimental pipeline.
(A) Effect of 0%, 5%, 10%, and 15% of a 0.9 kg ae ha−1 field rate of glyphosate on A. thaliana floral shoot development. (B) Schematic of glyphosate treatment and tissue for harvesting gDNA. (C) Pipeline for analyzing methylC-seq data to identify differentially methylated cytosines (DmCs) and differentially methylated regions (DMRs). (D) Example of DMRs identified by bsseq. Blue lines represent methylation levels across the window of individual replicates of control plants and red lines represent methylation levels across the window of individual 5% or 10% glyphosate-treated plants.

