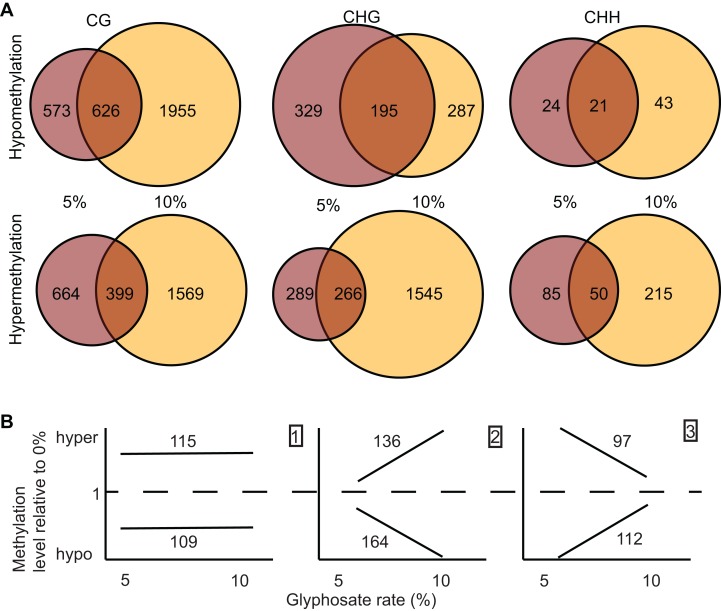
Figure 3. Identification and dose-dependency of DMRs.
(A) overlap of DMRs between the 5% and 10% glyphosate treatment groups by sequence context. (B) Number of 5% and 10% overlapping DMRs that exhibit glyphosate dose-independent (panel 1), positive dose-dependent (panel 2), or inverse dose-dependent (panel 3) methylation responses based on non-parametric curve fitting and statistical test for significant difference between the doses at p < 0.05. All DMRs are described in Dataset S3. The list of dosage classification for all overlapping DMRs is available in Dataset S4. Glyphosate percentages based on a 0.9 kg ae ha−1 rate.

