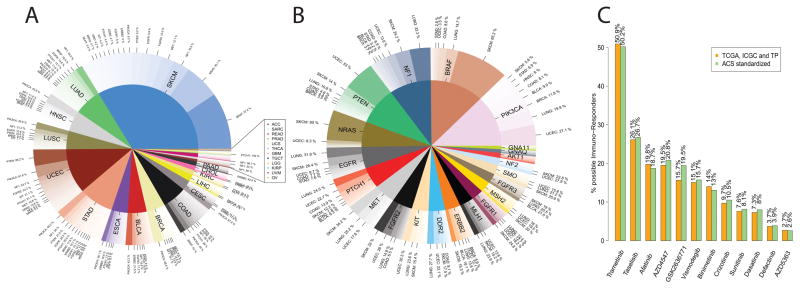
Figure 3.
(A) Plot showing the most common mutations in each tumor type for the samples predicted to respond to combination therapy. These genes can be selected for tumor specific clinical trials for combination therapy. (B) Genes and tumor type standardize to 2016 Cancer Statistics. (C) Percent of samples predicted to benefit from combination therapy that could receive each targeted drug based on the mutation profile. Orange, data from combined databases (TCGA, ICGC and TP). Green, data from 2016 Cancer Statistics Standardized analysis.

