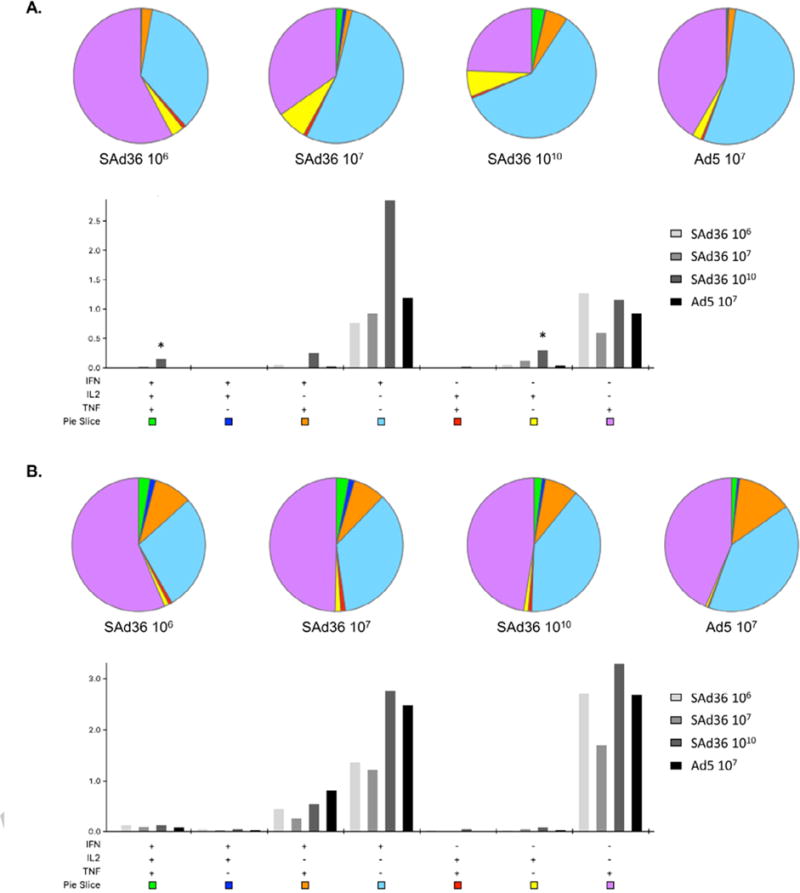
Figure 3. Cytokine production by CD8+ and CD4+ T cells stimulated ex vivo with the PyCMP protein.

Female CB6F1/J mice (n = 5 per group) were vaccinated according to the regimens described in Table 1. (A) Pie Charts: Percentage of multifunctional and single cytokine producing CD8+ T cells following ex vivo stimulation with PyCMP protein at day 70 post priming. Bar Graph: Percentage of total CD8+ T cells capable of producing one, two, or three cytokines following ex vivo stimulation with PyCMP protein. Results are presented as the percentages of positive cells per 106 CD8+ T cells. (B) Pie Charts: Percentage of multifunctional and single cytokine producing CD4+ T cells following ex vivo stimulation with PyCMP protein at day 70 post priming. Bar Graph: Percentage of total CD4+ T cells capable of producing one, two, or three cytokines following ex vivo stimulation with PyCMP protein. Results are presented as the percentages of positive cells per 106 CD4+ T cells. Graphs were produced and data was analyzed using SPICE software [36].
