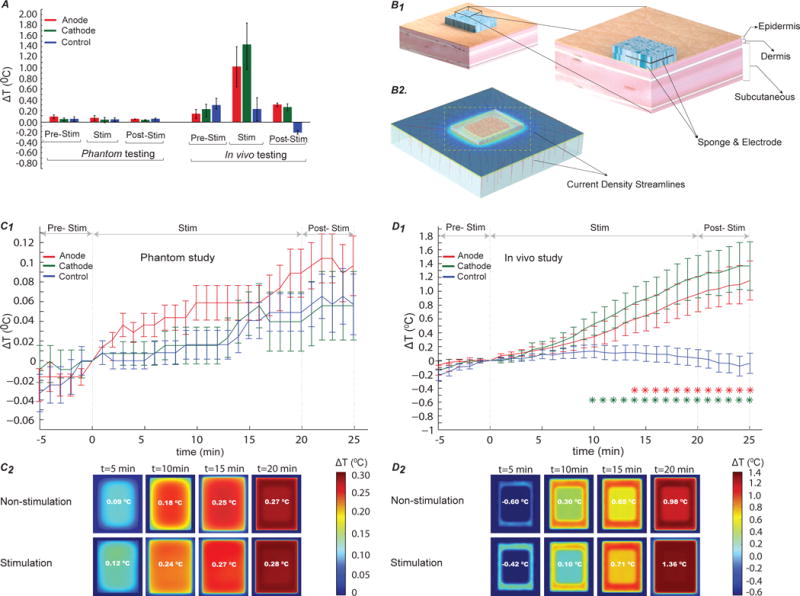
Figure 1. Skin surface temperature changes under tDCS electrodes during pre-stimulation, stimulation, and post-stimulation phases in the phantom from in vivo studies, and FEM simulations.

(A) Average temperature change in subjects (right) and phantom (left) normalized to temperature at t= 0. The error bars indicate standard error of mean (SEM). In the phantom, ΔT was approximately same across test samples and mode of stimulation, whereas in the in vivo study, maximum ΔT was measured under the active electrode (max. under cathode) during stimulation compared to the control. (B1) Architecture of a skin model showing skin layers (epidermis, dermis, and subcutaneous layers) and electrode positioning on the skin surface. (B2) represents an orientation of current density flow streamlines inside the different skin tissue layers. (C1) Analysis of normalized average ΔT in the phantom study (p < 0.01). No significant difference in ΔT was found in the control, compared to the anode and the cathode. (C2) Illustration of predicted ΔT for the non- stimulation (control) and stimulation cases in the FEM phantom model. Predicted results indicated no significant effect of stimulation on the phantom. (D1) In vivo analysis of temperature difference over time within subjects during pre-stimulation, stimulation, and post-stimulation. Red and green asterisks symbolize statistical significant difference (p < 0.01) between anode and control, and cathode and control respectively. There was a significant difference in ΔT under the anode (p < 0.01) and the cathode (p < 0.01), compared to the control. Temperature under both anode and cathode gradually increased due to stimulation, compared to that of control. (D2) FEM representation of the predicted ΔT in the skin model. Maximum ΔT of 1.36°C was predicted during direct current stimulation by the FEM model.
