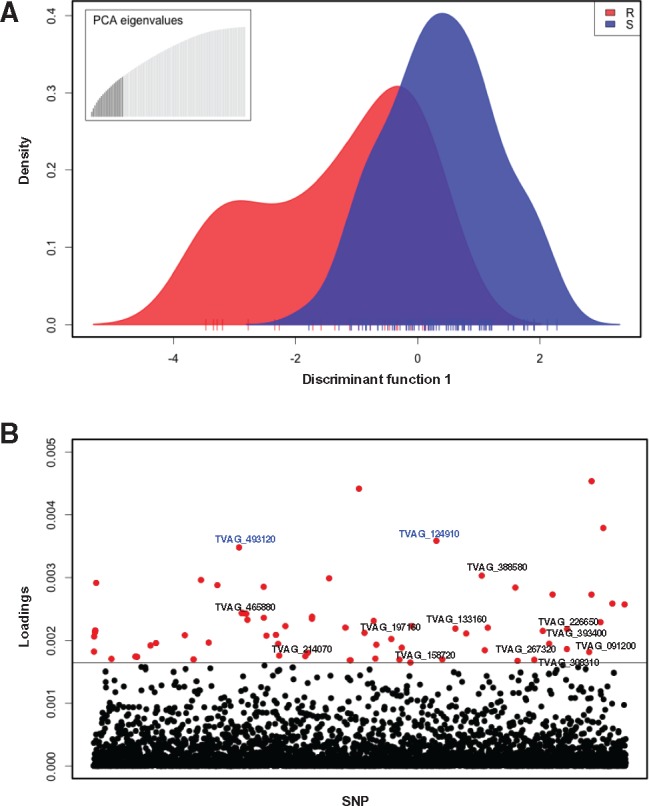
Fig. 3.

—Association mapping for Mz resistance in T. vaginalis. (A) Discriminant analysis of principal components (DAPC) representing variation and distribution of markers between drug resistant (red) and drug sensitive (blue) isolates. Ticks on the x-axis represent individual isolates. The inset represents the distribution of eigenvalues, with the black histogram showing all the principle components that were used in the DAPC analysis. (B) Loadings plot of the SNPs used for association analysis. The distribution of variances for SNP markers within and between resistant and sensitive isolates is represented as a loading value for each marker. The loading values above the threshold represent the largest between-group variance and the smallest within-group variance and are associated with the resistant phenotype. SNP markers are indicated on the x-axis, and the loadings value for each SNP on the y-axis; a horizontal line indicates the loadings threshold. Red dots represent 72 SNPs identified as significantly contributing to Mz resistance. Text in blue font represents two nonsynonymous SNPs in two conserved hypothetical genes (TVAG_493120 and TVAG_124910) common to both moderate (MLC ≥ 100) and high (MLC ≥ 400 Mz) phenotypes.
