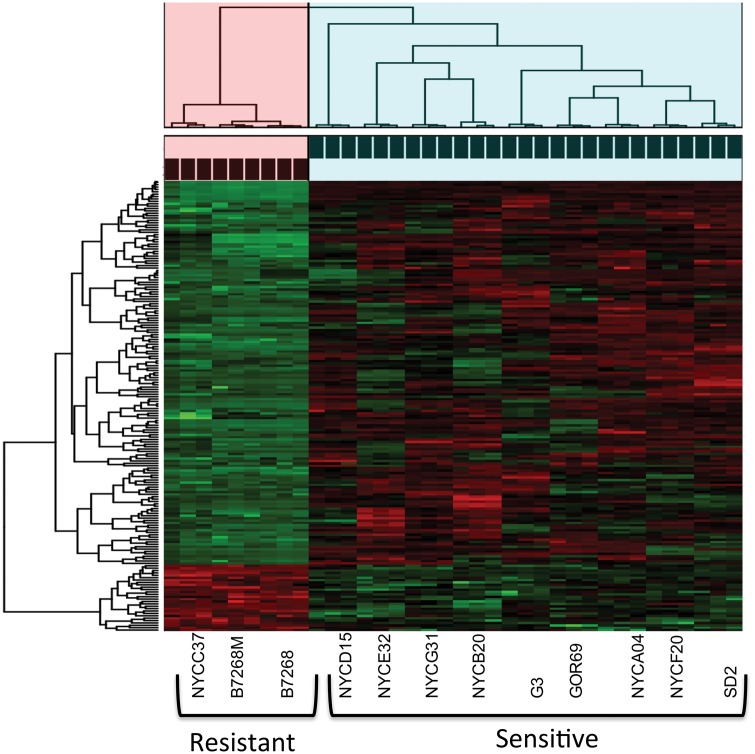
Fig. 6.
—Heatmap and cluster analysis of the association between gene expression and Mz resistance phenotype for commonly up- and down-regulated genes in T. vaginalis. Heatmap is constructed on normalized gene read counts. Cluster analysis and chi-square analysis were performed on genes that had significant expression changes in each resistant strain in comparison to sensitive strains. Drug resistance strains significantly clustered together based on their gene expression profile for 162 downregulated and 28 upregulated genes (chi-square test, P = 2.76e-08). Green color represents downregulated genes, red color represent upregulated genes in resistant strains. Pink cluster represent three resistant strains (Resistant cluster = 9 samples), while blue cluster represents nine sensitive strains (Sensitive cluster = 27 samples) corresponding.

