Fig. 7.

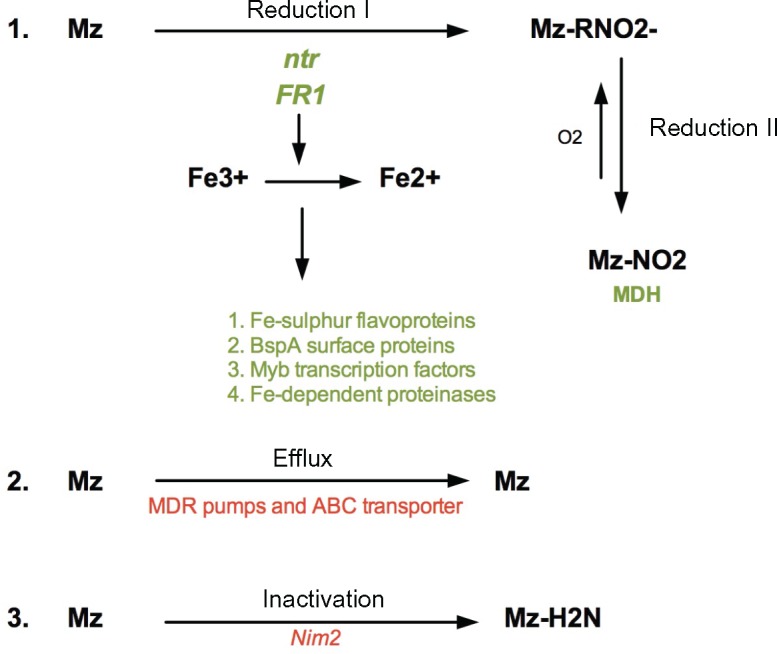
—Summary and proposed model of Mz resistance as three major processes: (1) Drug reduction, (2) Drug Efflux, and (3) Drug inactivation. Red color represents upregulated genes, green color represents downregulated genes.

—Summary and proposed model of Mz resistance as three major processes: (1) Drug reduction, (2) Drug Efflux, and (3) Drug inactivation. Red color represents upregulated genes, green color represents downregulated genes.