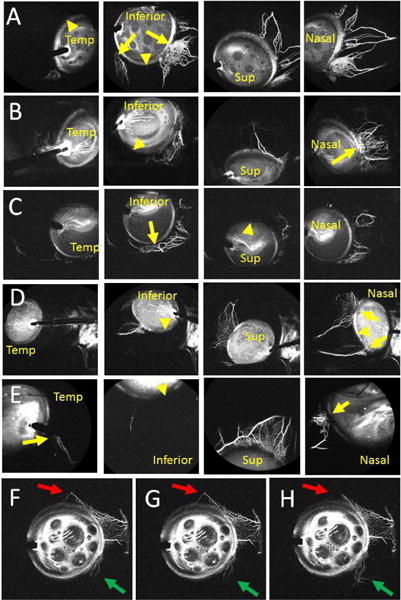
Figure 1.

Aqueous Angiography Shows Segmental Outflow Patterns in Living Human Subjects Aqueous angiography in different positions for subject 1 (Row A; right eye), subject 2 (Row B; right eye), subject 3 (Row C; right eye), subject 4 (Row D; left eye), and subject 5 (Row E; left eye). Arrows identify areas with segmental angiographic signal and arrowheads point out regions without angiographic signal. F-H, Subject 6 showed a simultaneous dynamic inferonasal increase (green arrows) and superior decrease (red arrows) in angiographic signal. Sup = superior; Temp = temporal.
