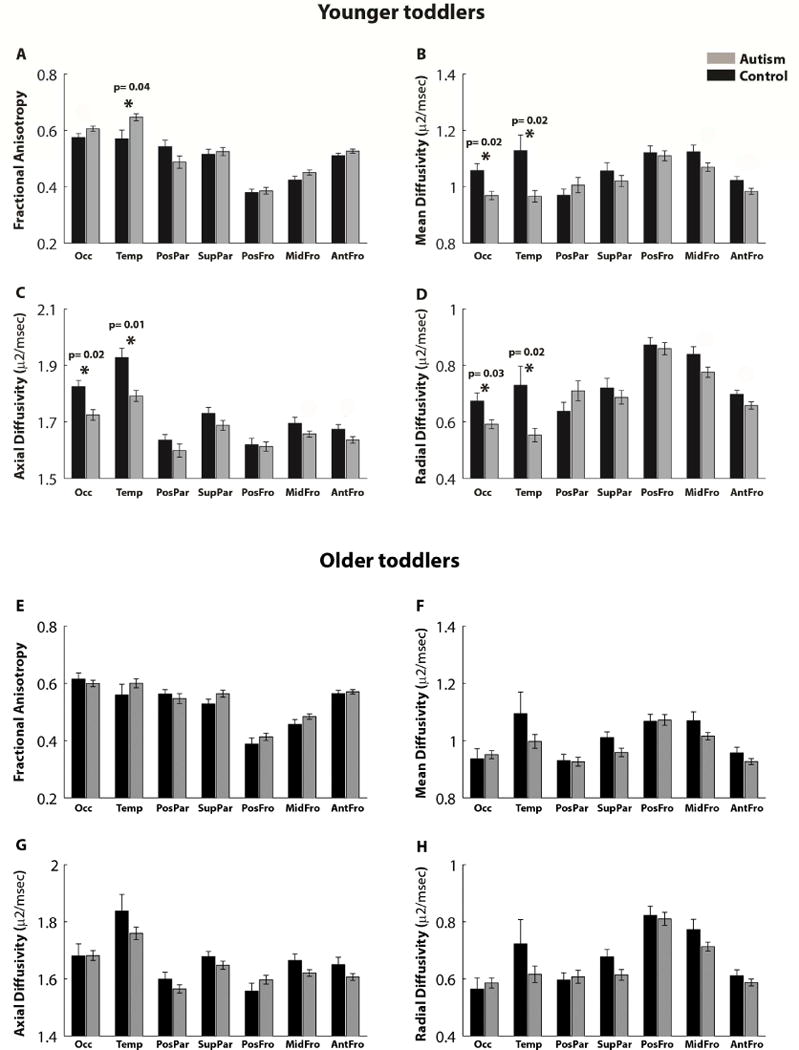
Figure 2.

Comparison of diffusion properties in the seven CC tracts across the younger autism and control toddlers (<2.5 years old, A–D) and the older autism and control toddlers (>2.5 years old, E–H). Mean fractional anisotropy (A,E), Mean diffusivity (B,F), Axial diffusivity (C,G), and Radial diffusivity (D,H) are presented for the autism (gray) and control (black) groups. Error bars: standard error of the mean across subjects. Asterisks: significant differences across groups after FDR correction (specific p values are noted for significant tracts).
