Fig. 5.

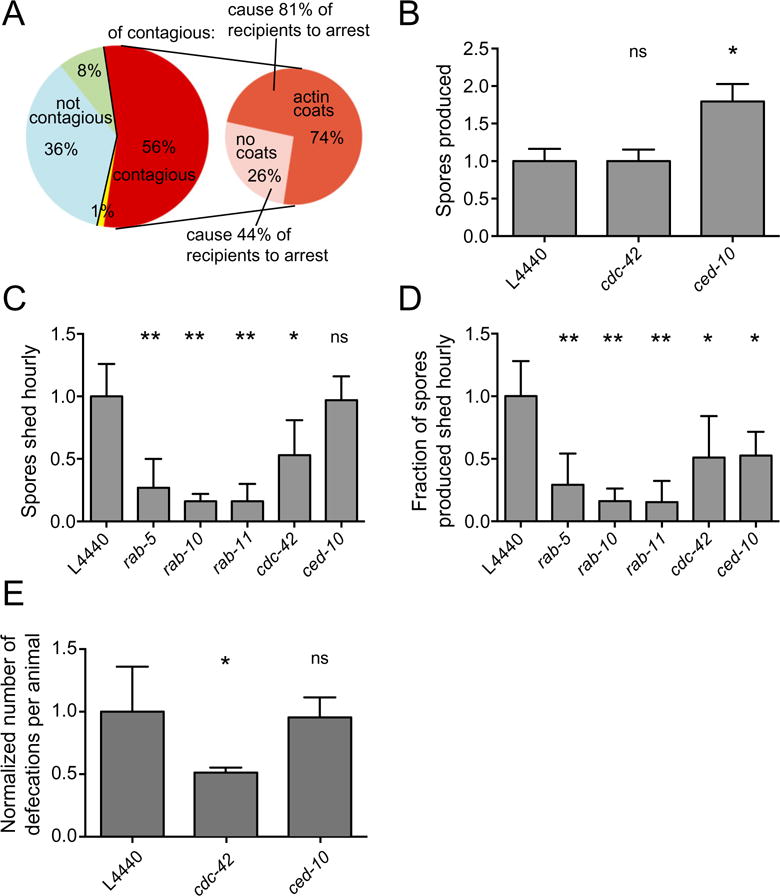
ACT-5 coats are correlated with spore exit and contagiousness, but are not required.
A. Contagiousness of 84 infected donor animals was compared with the presence of spores and ACT-5 coats after exposure to recipients. Non-contagious donors are shown in blue (no spores present, n = 30, 36%) and green (spores present, no ACT-5 coats, n = 7, 8%). One donor (yellow) was recorded to have no spores but was contagious, likely due to the presence of spores that were missed during visual inspection. Contagious donors (n = 46, 56%) are shown in red. These donors are subdivided into those that had ACT-5 spore coats (dark orange, n = 34, 74% of contagious animals) and those that did not have ACT-5 spore coats (pink, n = 12, 26% of contagious animals). Donors with ACT-5 coats caused recipients to become more heavily infected, leading to larval arrest 81% of the time, as opposed to 44% recipient larval arrest caused by donors without ACT-5 coats. Data combined from two biological replicate experiments.
B. Spore production in N2 RNAi-treated animals was quantified at 44 hpi. The total number of spores released from 50 lysed infected animals was quantified and normalized to the values from L4440 (vector alone) control RNAi-treated animals. Mean is from three independent experiments.
C. Quantification of spore shedding in N2 animals treated with RNAi against genes identified in Fig. 3 as regulators of ACT-5-coated spores. The normalized number of spores excreted per animal per hour is shown on the y-axis (mean is from three to four independent experiments for each sample), RNAi clone is shown on the x-axis.
D. Fraction of total spores produced that are excreted hourly. Normalized spore-shedding data for each sample (B) were divided by the normalized total number of spores produced for each sample (panel C and Szumowski et al., 2014 for Rab values) to give the fraction of the total spores produced that are excreted hourly. Propagation of error from combined experiments was calculated by taking the square root of the sum of standard deviations from all experiments squared, n = 6.
E. Defecation counts of RNAi-treated animals normalized to control L4440 values. The normalized number of defecation events over a 35 min period for groups of eight worms over three independent experiments is shown on the y-axis.
B–E show mean and standard deviation of independent experiments normalized to control L4440 values. Analysis of variance was used to calculate P-values indicated above graphs, comparing each sample to the L4440 control: ns, not significant; *P < 0.05; **P < 0.001.
