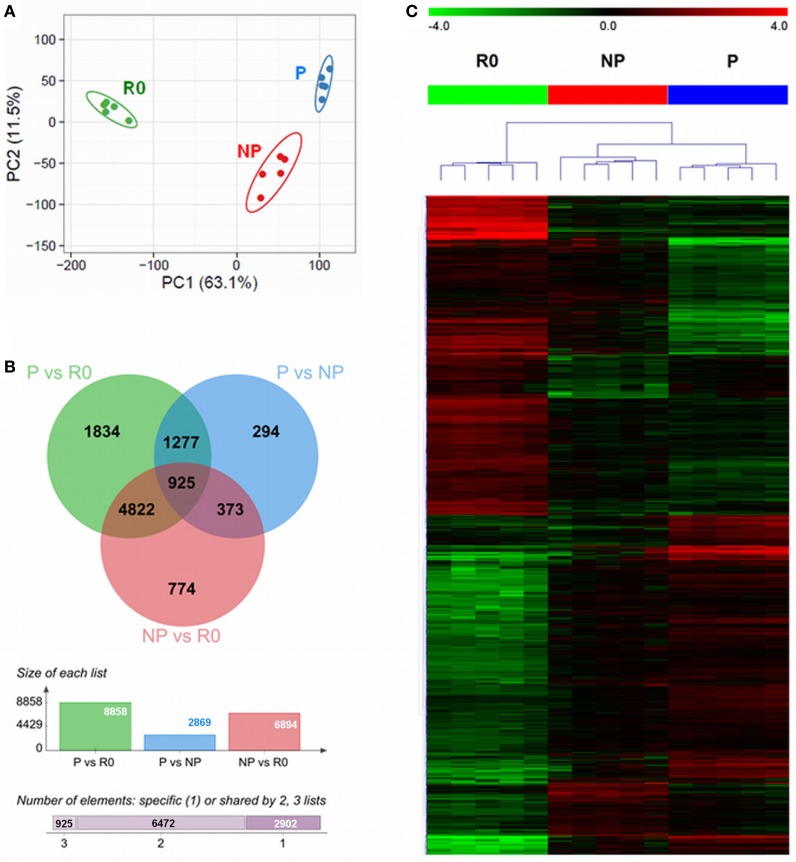
Figure 3.
Differential transcriptome signatures between resting, proliferating, and non-proliferating natural killer (NK) cells expanded with IAPs. (A) Unsupervised principal component analysis of the transcriptomes of all samples (n = 5) for resting (R0); proliferating (P), and non-proliferating (NP) NK cells, displays the samples in a scatterplot of principal component 1 and principal component 2. The prediction ellipses are indicative of that with a 95% probability a new observation from the same group will fall inside the ellipse. (B) Venn diagram (top) displaying the overlap between the numbers of differentially expressed transcripts of each pairwise comparison, PvsR0, PvsNP, and NPvsR0. The columns diagram (middle) indicate the total number of differentially expressed reporters per pairwise comparison, and the horizontal bar (bottom) summarizes the number of transcripts specific or shared between two or three groups. (C) Heat map of all differentially expressed transcripts after hierarchical clustering (Euclidean distance, complete linkage method). Fold-change differences (row-wise centered to the median) are displayed within color saturation limits −4 (green) to +4 (red).

