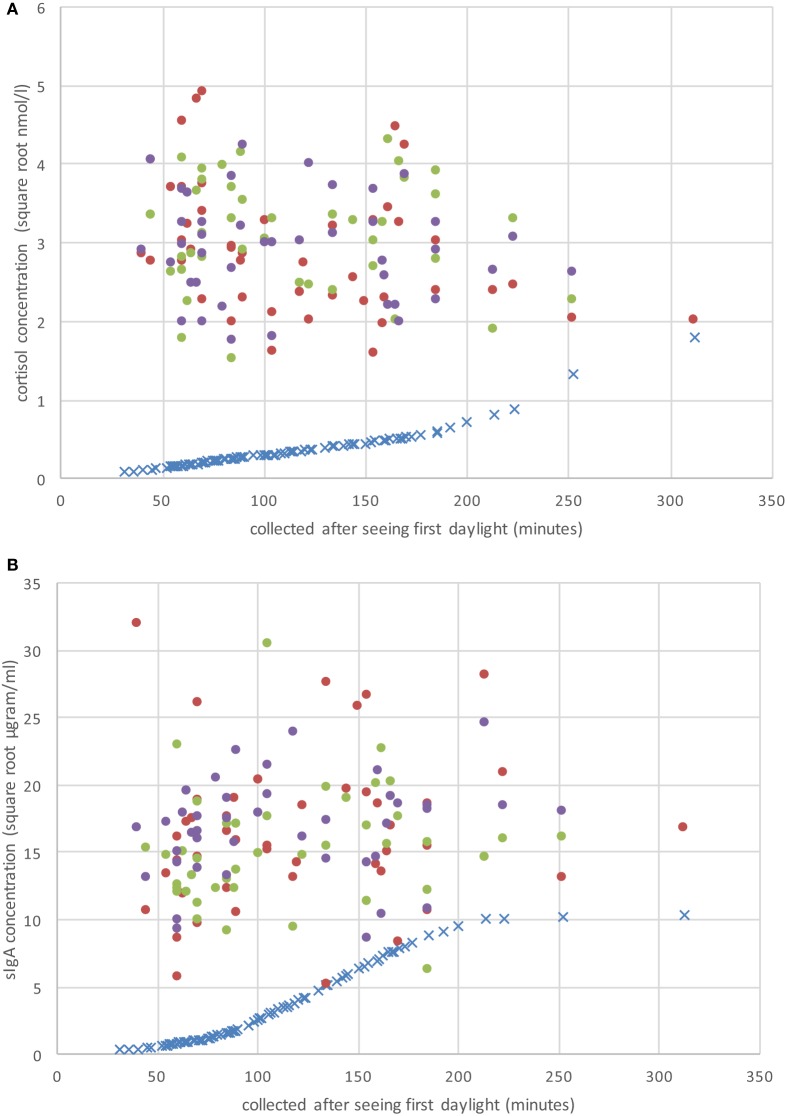
Figure 1.
Raw CS (A) and secretory immunoglobulin A (sIgA) (B) concentrations on the three sample periods (day 1 = solid red dots; day 2 = solid green dots; day 3 = solid purple dots), and the individual adjustment concentration value (blue “×”) based on Hucklebridge et al. (24) as a function of when the sample was collected after seeing first daylight (in minutes).

