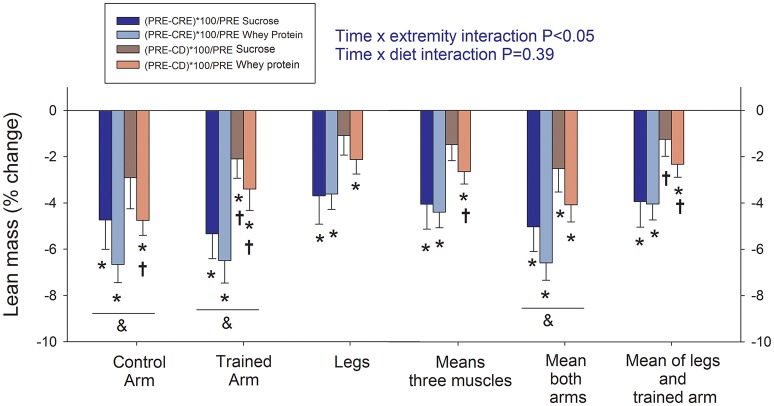
Figure 2.
Assessment of changes in lean mass (fat-free mass—bone mass) by dual-energy x-ray absorptiometry. PRE, baseline tests; CRE, caloric restriction (13.4 kJ/day) and exercise (45 min arm cranking and 8 h walking per day) for 4 days; CD: 3 days on a diet isoenergetic with that consumed during the PRE phase + reduced exercise. The vertical bars represent the mean values and the error bars the standard error of the mean. Sucrose: in dark colors (n = 7) and whey protein: in light colors (n = 8). *P < 0.05 compared to PRE; †P < 0.05 compared to CRE; &P < 0.05 arms compared to legs.

