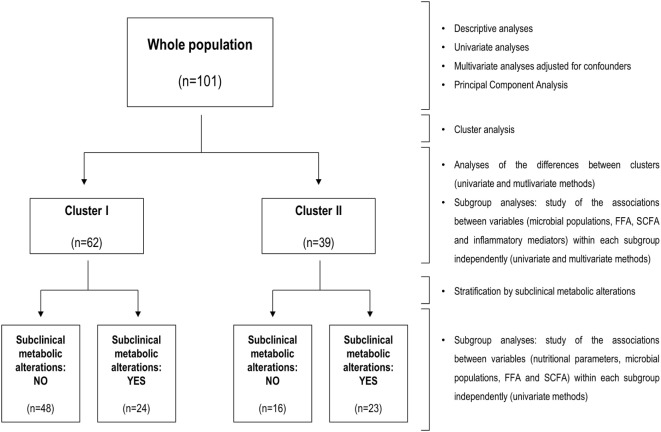
Figure 1.
Flow diagram of the statistical analyses. Summary of the workflow followed in the statistical analyses performed in the present study. The flow diagram (left) indicates groups analyzed and sample sizes, whereas statistical methods for analysis and stratification of the study population are indicated at the left side.

