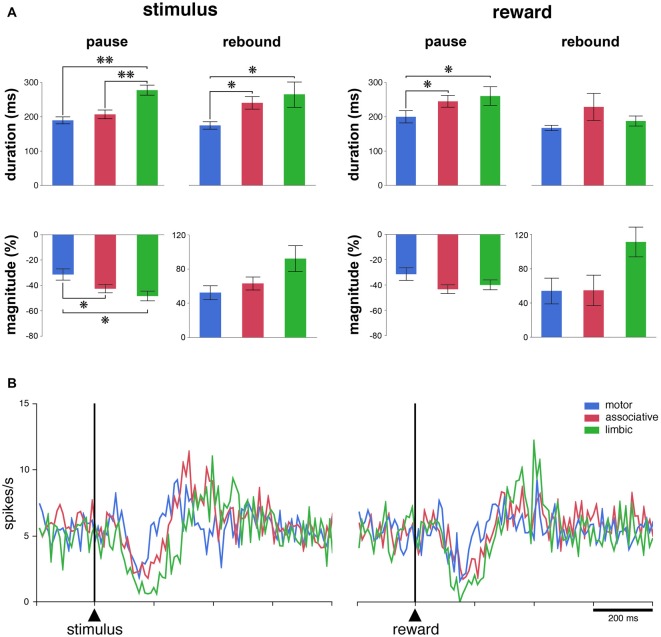
Figure 3.
The responsiveness of TANs to task events in distinct striatal regions. (A) Comparison of durations and magnitudes of the two components of TAN responses (pause and rebound) to the stimulus and reward across striatal regions. Magnitudes of changes are indicated as decreases (pauses) or increases (rebounds) in percentage below baseline activity. Results are pooled for the two monkeys. Values are means ± SEM. **P < 0.01, *P < 0.05. (B) Population average activity of TANs recorded in the three striatal regions. Each curve indicates the mean activity averaged across neurons recorded in a given region for both animals as a function of time from stimulus onset (left) and reward delivery (right). Both the responsive and nonresponsive TANs are included.

