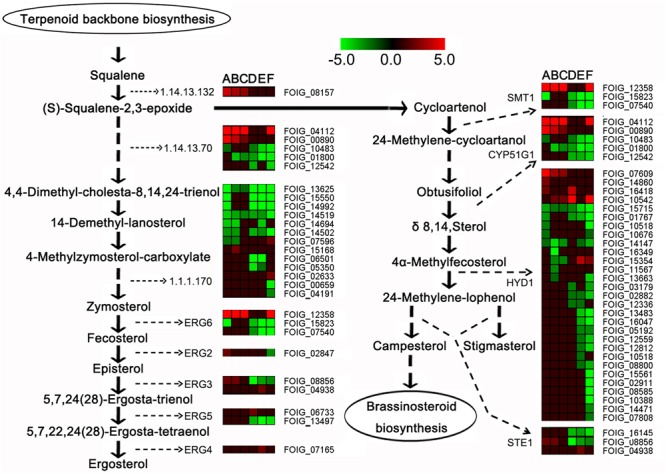
FIGURE 6.

Expression profiles of steroid biosynthesis-related genes. In the heatmap, (A–C) represent 1.5-C, 6-C, and 12-C (controls after 1.5, 6, and 12 h of incubation), and (D–F) represent 1.5-T, 6-T, and 12-T (treated samples after 1.5, 6, and 12 h of DT exposure), respectively.
