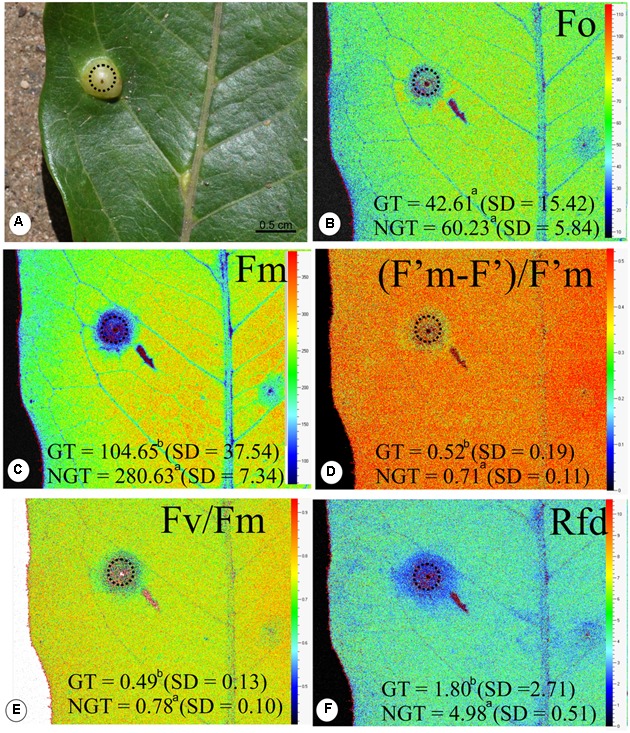
FIGURE 3.

Fluorescence quenching analysis performed (means ± standard deviation) in non-galled tissues of Matayba guianensis (Sapindaceae) and in galls induced by Bystracoccus mataybae (Eriococcidae) using a modulated fluorescence imaging apparatus (Handy Fluorcam PSI – Photo Systems Instrument, Czech Republic). (A) Leaflet with a gall (doted circle). (B) Imaging of F0 (minimum fluorescence of PSII in dark-adapted state). (C) Imaging of Fm (maximum fluorescence of PSII in dark-adapted state). (D) Imaging of (F’m–F’)/F’m (PSII operating efficiency). (E) Imaging of Fv/Fm (maximum PSII quantum yield in dark-adapted state). (F) Imaging of Rfd (instantaneous fluorescence decline ratio in light). GT, galled tissue; NGT, non-galled tissue, SD, standard deviation. Values followed by the different letters differ significantly by the Wilcoxon test.
