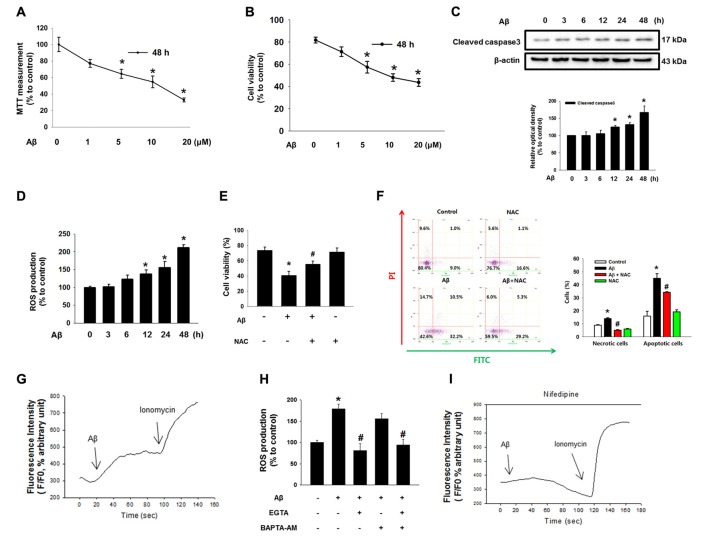
Figure 1.
Effect of amyloid β (Aβ) on neuronal cell death. (A) SK-N-MC cells were exposed to various concentration of Aβ (0–20 μM) for 48 h. Cytotoxicity was measured by MTT assay at an absorbance of 545 nm using a microplate reader. Data are presented as a mean ± SE. n = 6. (B) Cell viability was measured using a counting chamber by trypan blue exclusion assay. Data are presented as a mean ± SE. n = 6. (C) Cells were exposed to Aβ (5 μM) for 0–48 h. Cleaved caspase-3 was detected by western blot. n = 4. (D) Reactive oxygen species (ROS) measurement by CM-H2DCFDA was conducted by using luminometer. Data are presented as a mean ± SE. n = 6. (E) Cells were treated with Aβ (5 μM) and N-acetyl-L-cysteine (NAC; 1 mM) for 24 h. Cell viability was measured by trypan blue exclusion assay. Data represent the mean ± SE. n = 6. (F) Necrotic and apoptotic cells were counted by using annexin V/PI analysis with flow cytometry. Data are presented as a mean ± SE. n = 4. (G,I) SK-N-MC cells were loaded with 2 μM of Fluo-3 AM for 40 min, subsequently pretreated with Nifedipine (10 μM) for 30 min prior to Aβ treatment for 24 h. (H) Cells were pretreated with EGTA (1 mM) and BAPTA-AM (10 μM) for 30 min prior to Aβ treatment. ROS measurement was performed by using luminometer. Data are presented as a mean ± SE. n = 6. Each blot result shown is representative image. Quantitative blot data are presented as a mean ± SE. n = 4. *p < 0.05 vs. control, #p < 0.05 vs. Aβ treatment.

