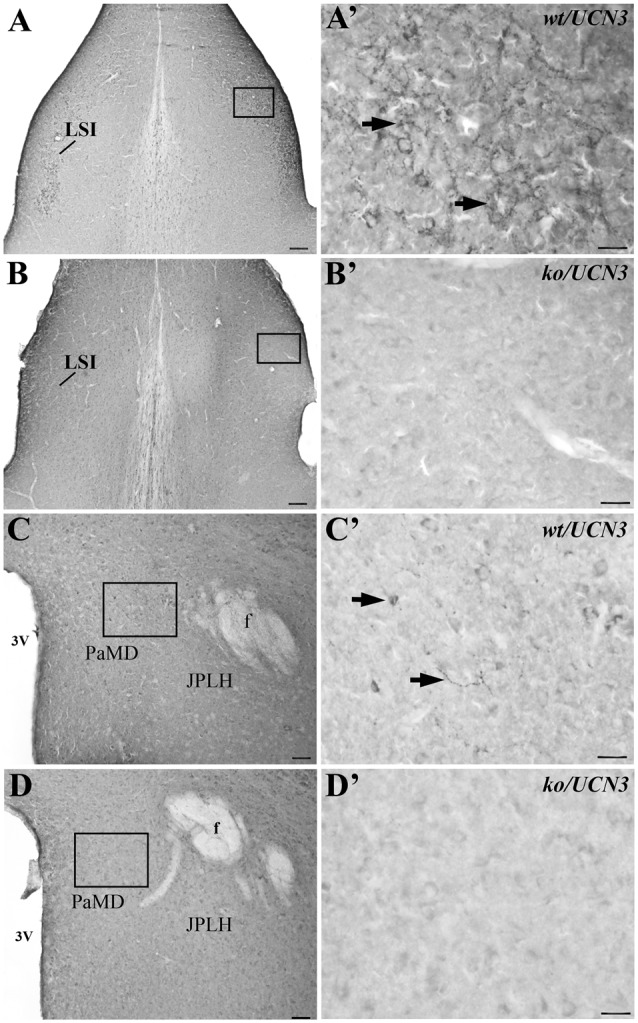
Figure 3.

Representative photomicrographs illustrating UCN3 immunostaining in the intermediate part of the lateral septal nucleus (LSI) and paraventricular hypothalamic nucleus, magnocellularpart, dorsal division (PaMD) regions of wild-type UCN3 (wt/UCN3) mice or “knockout” UCN3 (ko/UCN3) mice. (A) Bright field photomicrograph showing the LSI region of a wt/UCN3 mouse. (A′) Higher magnification of (A) UCN3-ir cells and fibers, indicated by black arrows. (B) Bright field photomicrograph showing the LSI region of a ko/UCN3 mouse. (B′) Higher magnification of the square area in (B). Note the absence of labeling. (C) Bright field photomicrograph revealing the PaMD region of a wt/UCN3 mouse. (C′) Higher magnification of the square area in (C) showing UCN3-ir cells and fibers, indicated by black arrows. (D) Bright field photomicrograph the PaMD region of a ko/UCN3 mouse. (D′) Higher magnification of the square area in (D). Note the absence of labeling. Scale bars: 100 μm (A,B); 50 μm (C,D); 20 μm (A′–D′).
